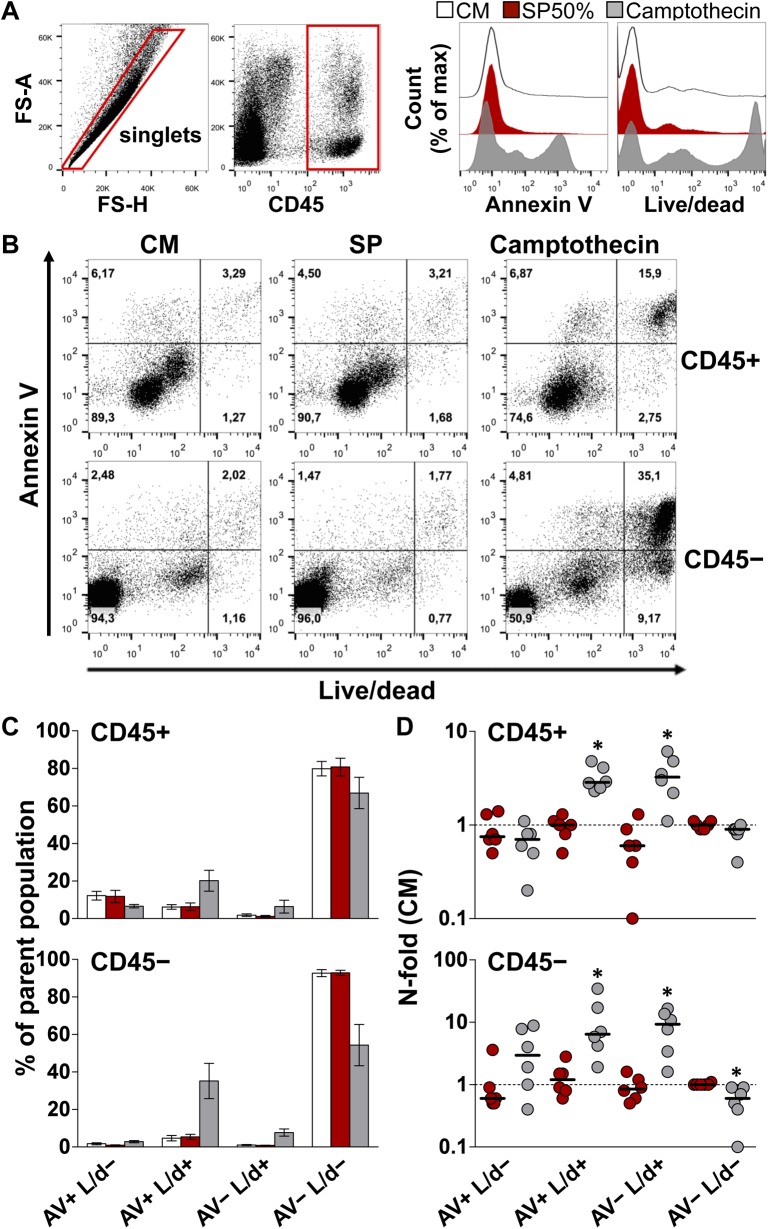
Fig 4. Viability of cells isolated from ectocervical tissue explants.
Cells were isolated from ectocervical explants after incubation with culture medium (CM, white) or seminal plasma (SP, red) 50% for 12 h, followed by an additional 12 h-incubation with medium only. As a positive control, camptothecin 100 μM (grey) was used to induce apoptosis upon explant treatment for 24 h. Cells were stained with annexin V (AV) and an amine-reactive dye (Live/dead, L/d) and analyzed by flow cytometry. A) Representative dot plots of the gating strategy. Expression analysis of the two selected cell death markers was conducted on events phenotyped as immune (CD45+) and non-immune (CD45-) cells. Histograms depict the expression level of the cell death markers on singlets, which comprise both CD45+ and CD45- cells, isolated from donor-matched explants of one representative experiment. B) Dot plots of the fraction of cells expressing the two analyzed cell death markers among CD45+ (upper panel) and CD45- (lower panel) cells isolated from donor-matched explants of one representative experiment. C) Fraction of CD45+ (upper chart) and CD45- (lower chart) cells expressing different combinations of the two analyzed cell death markers. Bars represent mean with s.e.m (n = 6). D) N-fold change in the fraction of CD45+ (upper chart) and CD45- (lower chart) cells expressing different combinations of the two analyzed cell death markers from explants treated with SP (red) and camptothecin (grey) compared to untreated donor-matched explants (CM). Bars indicate median values. Asterisks denote a statistically significant difference with CM (Wilcoxon signed rank test, p<0.05).

