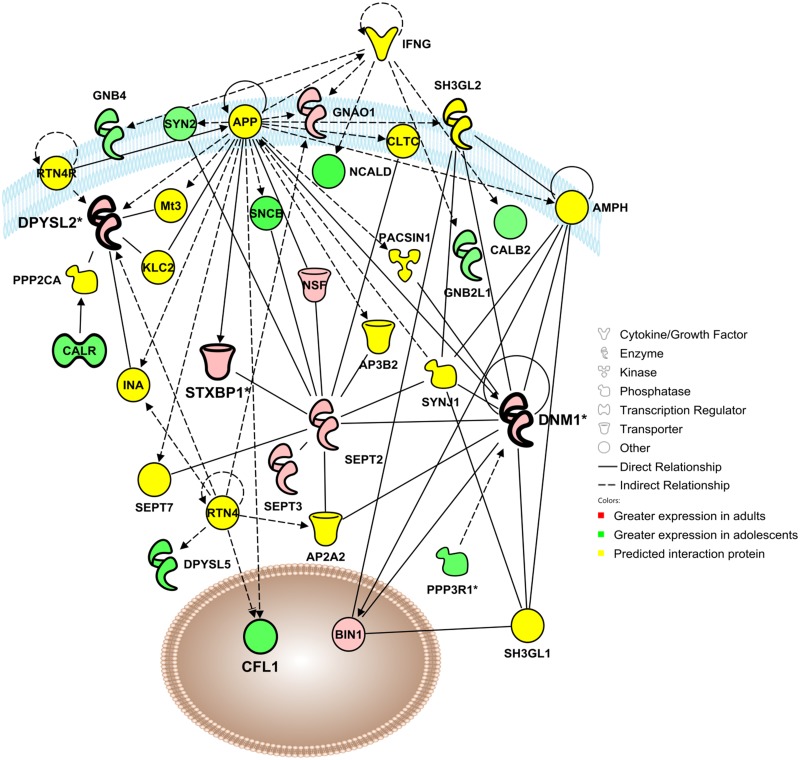
Fig 2. Adolescent development impacts a functional protein network involved in cellular assembly and organization, cellular function and maintenance, and cellular movement.
Visualization of a protein interaction network identified by Ingenuity Pathway Analysis as being altered by adolescent brain development (p-score = 29). Proteins shown in red were up-regulated in the adult mPFC, proteins in green were up-regulated in the adolescent mPFC, and proteins in yellow indicate statistically significant interaction proteins identified by IPA network analysis. Solid lines indicate a direct interaction, and dashed lines indicate an indirect interaction mediated by additional, non-significant proteins. Asterisks denote proteins that were identified multiple times in the proteomic analysis that have been consolidated into a single point in the functional network. Molecules for confirmation are indicated in bold, e.g. syntaxin binding protein 1 (STXBP1), dynamin-1 (DNM1) and dihydropyrimidinase-like-2 (DPYSL2).

