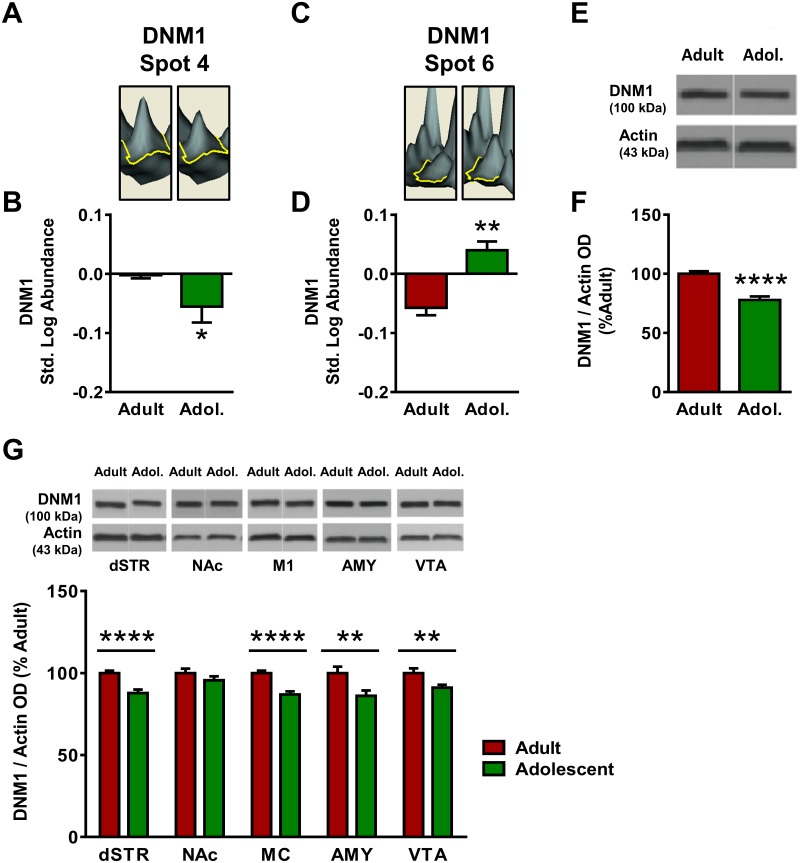
Fig 4. Adult and adolescent expression of dynamin-1 (DNM1).
(A) Representative 3D plot of DNM1 expression in adult (left) and adolescent (right) mice for Spot #4. (B) Standardized abundance (log) of DNM1 (Spot 4) demonstrating higher expression in adults versus adolescents (C) Representative 3D plot of DNM1 expression in adult (left) and adolescent (right) mice for Spot #6. (D) Standardized abundance (log) of DNM1 (Spot 6) demonstrating higher expression in adults versus adolescents. (E) Representative gel image of a Western blot for DNM1 expression to confirm 2D-DIGE changes. (F) Quantification of Western blot results, confirming reduced expression of DNM1 (normalized to actin) in adolescents as compared to adults. (G) Top, representative gel images for each brain region; bottom, quantification of Western blots for each brain region. DNM1 expression was higher in adults in dStr, M1, Amy, and VTA. There was no significant change in DNM1 expression in NAc (p>0.05). Data were expressed as percent change from mean adult within the same blot and graphed as mean ± SEM. (* indicates p≤0.05, ** indicates p≤0.01, *** indicates p≤0.001, **** indicates p≤0.0001).

