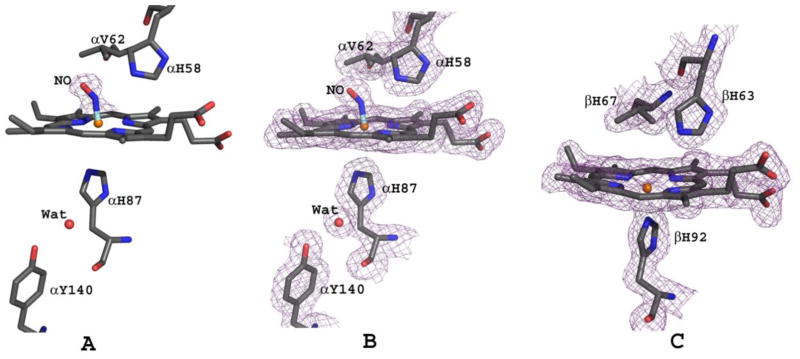
Figure 6.
The heme environment of bis-ligated T-state HbNO. (A) Difference electron density (Fo-Fc) map of bound NO (before NO was built into the model) at the distal side of α1-heme, contoured at 3.5σ. Similar density is observed at the α2-heme. (B) Final 2Fo-Fc map of bound NO at the distal side of α1-heme, contoured at 1.2σ. (C) Final 2Fo-Fc map of β1-heme, contoured at 1.2σ. Similar density observed at the β2-heme. The maps are superimposed with the final refined model.

