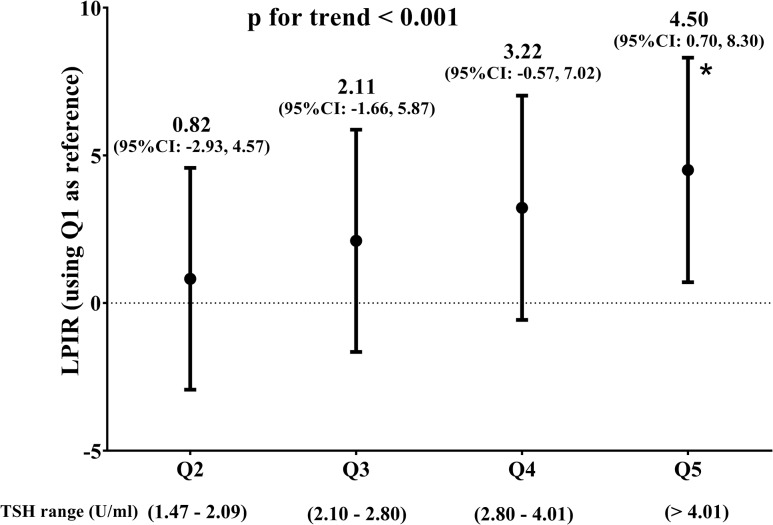
Figure 1.
LPIR according to TSH quintiles. LPIR score differences for TSH quintiles (Q) vs the first TSH quintile along euthyroid and SCH are shown. For linear regression for median TSH across categories, adjustment covariates include age, income, current smoking, race, household income, systolic blood pressure, high blood pressure treatment, menopause status, and hormone replacement therapy. The P value for the trend for median TSH values within each quintile is shown. *Bonferroni adjusted P value = 0.010 for the fifth quintile vs the first quintile.

