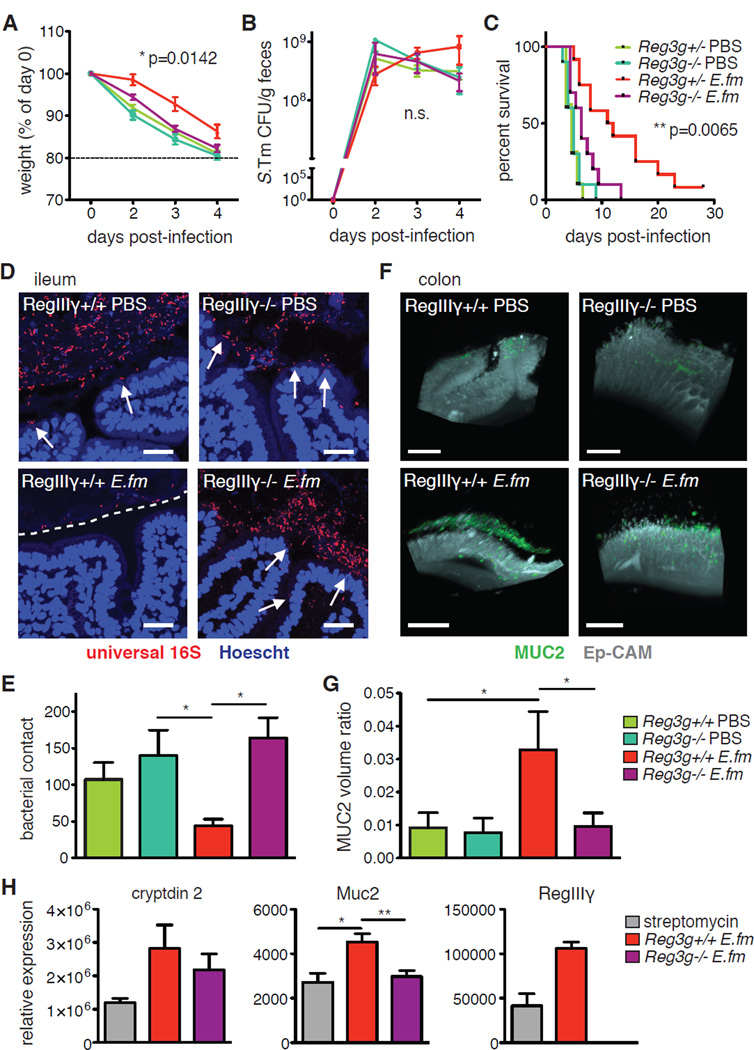
Fig. 4. E. faecium-induced expression of Reg3g is required for protection against S. Typhimurium.
(A–C) Reg3g−/− mice or +/− littermate controls were given AMNV for 7d and colonized with 108 E. faecium (E. fm) prior to oral infection with 106 S. Tm. (A) Weight loss, (B) S. Tm bacterial burden in feces, and (C) survival are shown. Pooled data from 4 independent experiments, n=10–12 mice/group. (D–G) Reg3g−/− mice or +/+ controls were given streptomycin 24h before gavage with 108 E. fm prior to oral infection with 106 S. Tm. (D) FISH staining for all bacteria (universal 16S probe) and epithelial nuclei (Hoechst) from intestinal tissues 48h p.i. Representative images, 40X objective, from 1 of 3 independent experiments, n=4–6 mice/group. White arrows indicate bacteria in contact with or invading through the epithelium, and white dashed line designates zone of segregation from bacteria. (E) Quantitation of bacterial contact from 4 images per mouse from (F). (F) Captured images of tissue-cleared, MUC2- and Ep-CAM-stained colon from mice treated as in (F). Corresponding videos are Movies S3–6. Scale bar = 200 µm. (G) Quantitation of MUC2 volume as a ratio to volume of Ep-CAM from 4 sections per mouse from (H). (H) Reg3g−/− mice or +/+ controls were gavaged with streptomycin 24h before gavage with 108 E. fm. IECs were harvested 4h later and analyzed by RQ-PCR for expression of shown genes. Pooled data from 2 independent experiments, n=3–6 mice/group. (A and B) mean±SEM, 2-way ANOVA, p-value shown comparing Reg3g−/− E. fm to Reg3g+/− E. fm, n.s.=not significant. (C) Log-rank analysis, p-value shown comparing Reg3g−/− E. fm to Reg3g+/− E. fm. (E and G) Kruskal-Wallis with Dunn’s post-test comparing all groups to Reg3g+/+ E. fm. (H) 1-way ANOVA with a Bonferroni post-test comparing all groups to each other. RegIIIγ expression shown as a control, all groups significant compared to knock-out but not depicted on the graph. *p≤0.05, **p≤0.01, ***p≤0.001 for all analyses. Comparisons with no (*) or bar had p>0.05 and were not considered significant.

