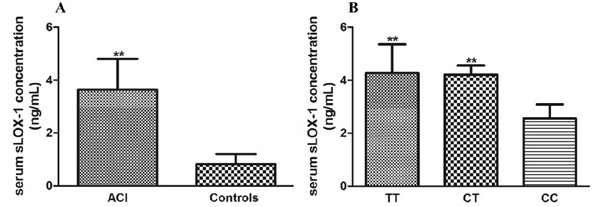
Fig. 4.

Serum levels of sLOX-1 in different groups (A) The difference in levels of sLOX-1 between patients with ACI and healthy controls. Data are expressed as mean ± SD, n = 240 in each group. Serum levels of sLOX-1 were assessed using ELISA. **P < 0.01 vs. healthy controls. (B) The effect of the LOX-1 rs1050283 polymorphism on sLOX-1 in patients with ACI. Data are expressed as mean ± SD, n = 45 in each genotype group. **P < 0.01 vs. CC genotype group. TT: TT genotype, CT: CT genotype, and CC: CC genotype.
