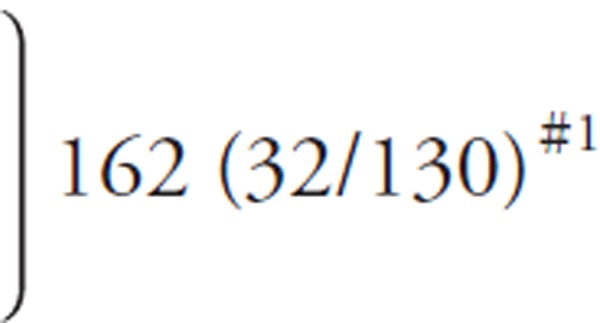
Supplemental Table 3. Comparisons of TG, LDL-C, and HDL-C distributions among various studies.
| Principal investigator | Miller et al. #1 | Miida et al. #2 | Present study |
|---|---|---|---|
| [Reference] | [2010, ref.#10; 2011, ref.#11] | [2012, ref.#5; 2014, ref.#6] | |
| Number of samples (postprandial samples, %) | |||
| Non-diseased group | 37 (5, 13.5%) | 49 (15, 30.6%) | 59 (43, 72.9%) |
| Diseased group | 138 (43, 31.2%) | 124 (55, 44.4%) | 109 (43, 39.4%) |
| Total | 175 (48, 27.4%) | 173 (70, 40.5%) | 168 (86, 51.2%) |
| TG (mg/dL) (Non-diseased/diseased) | |||
| ≥ 1,000 | 3 (0/3) | (5, excluded) | (3, excluded) |
| 600 ∼ 999 | 1 (0/1) | 9 (0/9) | 3 (0/3) |
| 400 ∼ 599 | 3 (0/3) | 8 (0/8) | 5 (0/5) |
| 200 ∼ 399 |  |
29 (0/29) | 34 (0/34) |
| < 199 | 127 (49/78) | 126 (59/67) | |
| LDL-Crmp (mg/dL) | |||
| ≥ 300 | 1 (0/1) | 1 (0/1) | 0 (0/0) |
| 200 ∼ 299 | 4 (0/4) | 4 (0/4) | 5 (0/5) |
| 100 ∼ 199 | 155 (36/119) | 119 (37/82) | 116 (43/73) |
| 50 ∼ 99 | 46 (12/34) | 47 (16/31) | |
| 20 ∼ 49 | 12 (1/11) | 3 (0/3) | 0 (0/0) |
| < 20 | 1 (0/1) | − | (1, excluded) |
| LDL-Crmp, not available | 2 (0/2) | − | − |
| HDL-Crmp (mg/dL) | |||
| ≥ 100 | 1 (0/1) | (1/5)#3 | (6, excluded) |
| 80 ∼ 99 | 7 (5/2) | 18 (10/8) | 7 (5/2) |
| 60 ∼ 79 |
 #1 #1
|
41 (22/19) | 52 (27/25) |
| 40 ∼ 59 | 87 (16/71) | 85 (23/62) | |
| 20 ∼ 39 | 21 (0/21) | 24 (4/20) | |
| < 20 | 4 (0/4) | − | (3, excluded) |
| HDL-Crmp, not available | 1 (0/1) | ||
LDL-Crmp, low-density lipoprotein-cholesterol concentration determined by the reference measurement procedure (RMP); HDL-Crmp, high-density lipoprotein-cholesterol concentration determined by the RMP.
The sample numbers given with the ranges of individual lipoproteins were determined using the data of the two publications, including supplemental data.
The sample numbers given with the ranges of individual lipoproteins were counted using original data.
Those with HDL-C > 100mg/dL were included in the study subjects in ref. #5, but excluded in ref. #6.
