. 2017 Jun 1;6:e23255. doi: 10.7554/eLife.23255

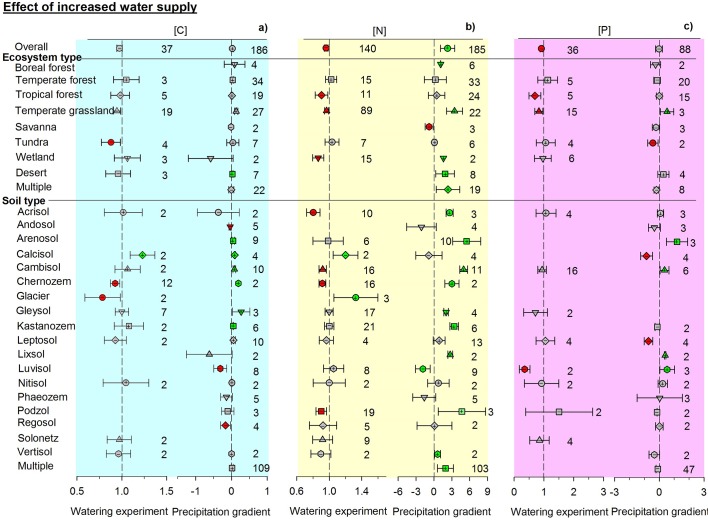
Figure 2. Responses of soil (a) C, (b) N, and (c) P concentrations to wetting by using response ratios in manipulative experiments and slopes in precipitation gradient observations.

Symbols with error bars show the mean response ratios or slopes with 95% confidence intervals. Plus (+) and minus (–) signs represent positive and negative means, respectively. Green symbols are positive and red symbols are negative means whose confidence intervals do not include zero. ‘Multiple’ indicates results from studies conducted across an environmental gradient for multiple types of ecosystems or soils. Manipulative experiments are on the left and gradient observations are on the right of each panel. Numbers indicate the number of studies used in each case.

DOI: http://dx.doi.org/10.7554/eLife.23255.003

Figure 2.

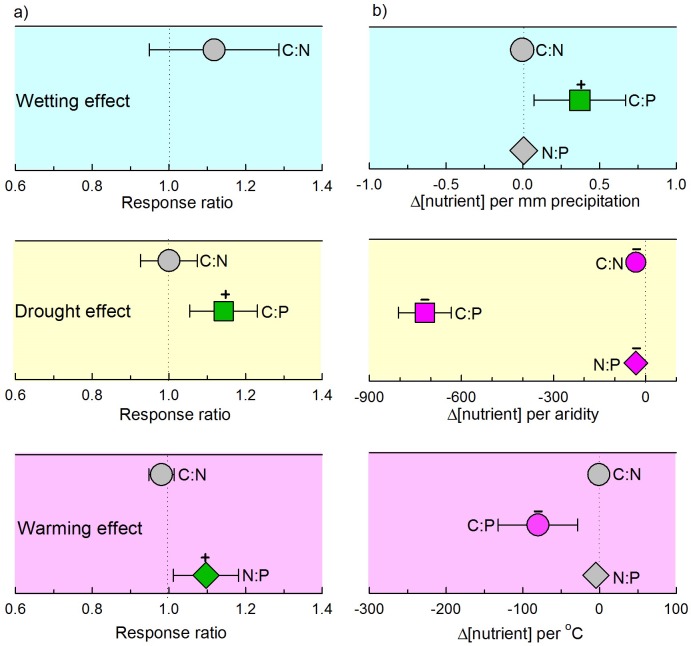
Figure 2—figure supplement 2. Response of soil C:N, C:P and N:P to precipitation, temperature and aridity in manipulative experiments (a) and gradient observations (b).

Figure 2—figure supplement 2.

Aridity is defined as 1–AI, where AI, the ratio of precipitation to potential evapotranspiration, is the aridity index. Symbols with error bars show the mean response ratios with 95% confidence intervals. Symbols are colored according to significant differences. Green symbols with a plus sign (+) and pink symbols with a minus sign (–) represent positive and negative differences, respectively. Due to limited sample size, we do not present differences among ecosystem or soil types.