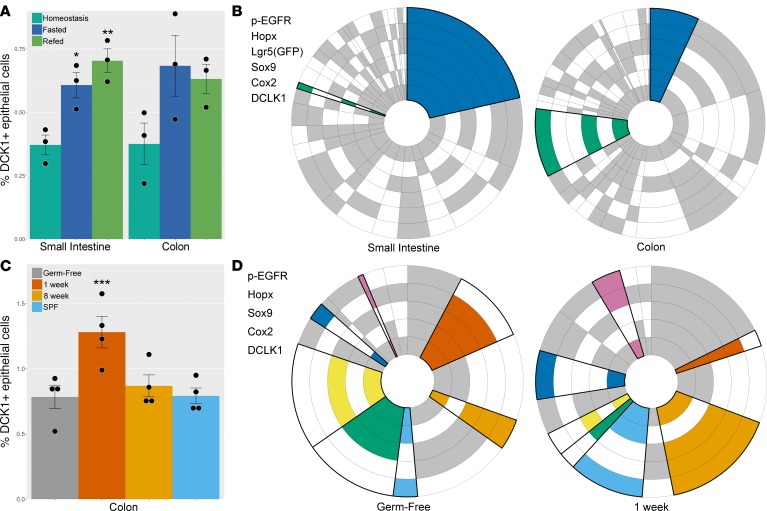
Figure 4. Intestinal tuft cell number and expression patterns.
(A) The proportion of tuft cells in the small intestinal epithelium was increased following fasting and remained elevated after 24 hours of refeeding (*P = 0.0320, **P = 0.0064; n = 3). Similarly, the colon showed an increase in the fraction of tuft cells after fasting and refeeding; however, these results did not reach statistical significance. (B) Circular plots demonstrate the proportion of each cell expression profile for each tuft cell marker. Statistically significant changes in expression profiles between sites and conditions are denoted by bold outlines and colors. Two expression profiles were different between tuft cells in the small intestine and colon at homeostasis (blue: P = 0.0038, green: P < 0.0001; n = 3 for each condition). (C) The proportion of tuft cells in the colon was increased 1 week after introduction of microorganisms compared to germ-free mice (***P = 0.0024; n = 4) but was unchanged 8 weeks after introduction of microorganisms or in specific pathogen–free (SPF) mice. (D) Overall, 7 tuft cell expression profiles were significantly different between germ-free mice and mice inoculated with microbiota for 1 week. Statistically significant changes in expression profiles between sites and conditions are denoted by bold outlines and colors (clockwise from top of plot: P = 0.0197, P = 0.0415, P = 0.0137, P = 0.0291, P = 0.0006, P = 0.0074, P = 0.0005; n = 4 for each condition). Two-tailed Student’s t test was used for statistical comparisons.

