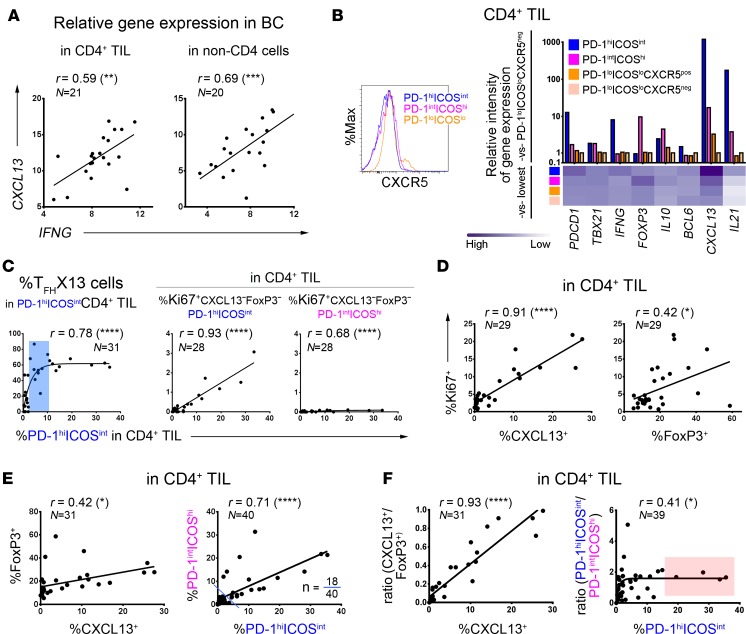
Figure 3. Relationships between the PD-1/ICOS–defined CD4+ tumor-infiltrating lymphocyte (TIL) subpopulations in human breast cancer (BC).
(A) Correlation between CXCL13 and IFNG gene expression (qPCR) in RNA extracted from purified CD4+ TIL or CD4-depleted fresh BC homogenates. (B) PD-1/ICOS–defined CD4+ TIL subpopulations: CXCR5 positivity (flow cytometry; histograms); marker gene expression in purified subpopulations (qPCR data; graph) from an extensively infiltrated BC. (C–F) Correlations based on flow cytometric analysis to determine the percentage of positive cells in fresh BC homogenates (n = indicated in each graph): (C) between TFHX13 containing PD-1hiICOSintCD4+ TIL and specific CD4+ TIL subpopulations (as indicated; blue zone represents a moderate extent of the PD-1hiICOSint subpopulation where TFHX13 TIL levels are heterogeneous); (D) between Ki67 and CXCL13 or FoxP3 expression in CD4+ TIL; (E) between (left) CXCL13 and FoxP3 and (right) PD-1hiICOSint and PD-1intICOShi in CD4+ TIL (18 of 40 BC contain significant levels of both subpopulations); and (F) between (left) CXCL13 and the CXCL13+/FoxP3+ ratio, and (right) PD-1hiICOSint and the PD-1hiICOSint/PD-1intICOShi ratio in CD4+ TIL. *P < 0.05, **P < 0.01, ***P < 0.001, ****P < 0.0001.

