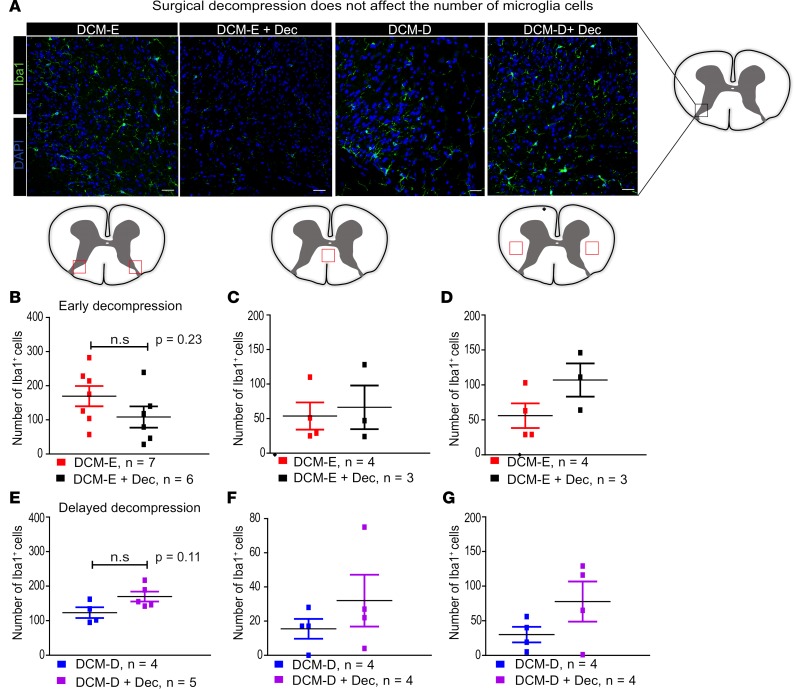
Figure 6. Surgical decompression does not affect the number of recruited microglia/macrophages in the spinal cord.
(A) Representative images of Iba1+ cells in the dorsal horn from mice at 5 weeks after either early or delayed decompression and age-matched sham controls. (B) At 5 weeks after decompression, Iba1+ cells were quantified in the regions of dorsal horns outlined by red squares, as indicated in the spinal cord diagram. A slight decrease in Iba1+ cells was detected in the dorsal horns of the DCM-E + Dec group (n = 6) compared with the DCM-E group (n = 7). (C and D) No significant differences were observed in the DCM-E group (n = 4) compared with the DCM-E + Dec (n = 3) in the dorsal columns (C) and the lateral corticospinal tracts (D). In all cases, the analyzed area is represented by the red squares in the diagram of the spinal cord. (E–G) No significant changes were observed in the number of Iba1+ cells in the dorsal horns (E), dorsal columns (F), and lateral corticospinal tracts (G) between the DCM-D (n = 4) and DCM-D + Dec (n = 5–4) at 5 weeks after decompression. All the results are presented as mean ± SEM of 5 to 6 slides per animal. Scale bars: 25 μm. DCM, degenerative cervical myelopathy; Dec, decompression; DCM-E, age-matched early sham decompressed group; DCM-D, age-matched delayed sham decompressed group.

