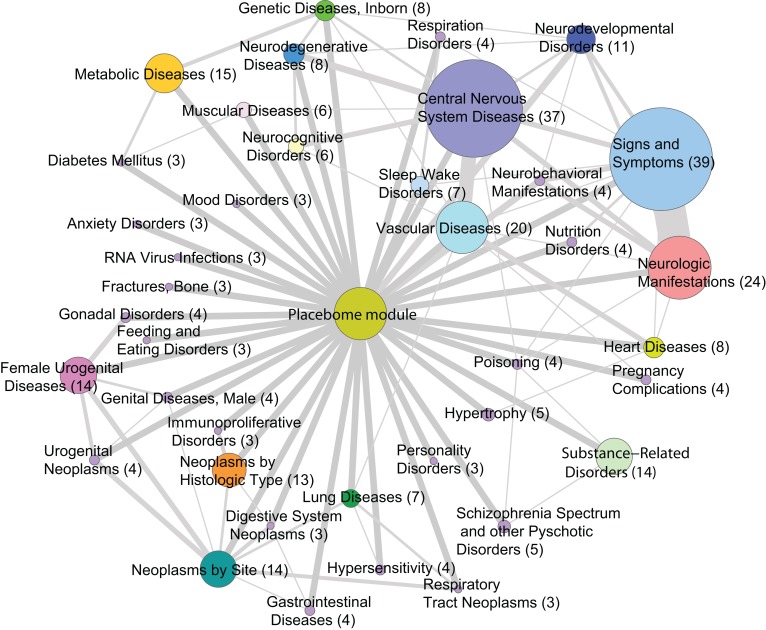
Figure 5. The placebome-disease network.
All nodes (except for the placebome module) represent disease groups with the size of the node proportional to the number of diseases in each group. The edges between the placebome module and disease groups represent the significantly proximate relationships of the disease modules in that group to the placebome module. The edges between disease groups indicate that the 2 groups have some shared diseases with the thickness of the edges proportional to the number of diseases in common.

