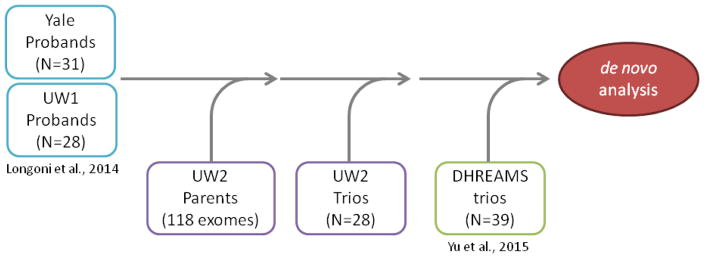
Fig. 1. Study flowchart.
Two groups of patients (UW1 and Yale) were sequenced as part of a previous study (Longoni et al. 2014). The corresponding parental samples and additional complete trios were sequenced in batch UW2. A cohort of 39 full trios (DHREAMS, Yu et al. 2015) was also used for the de novo mutation analysis and enrichment calculations.

