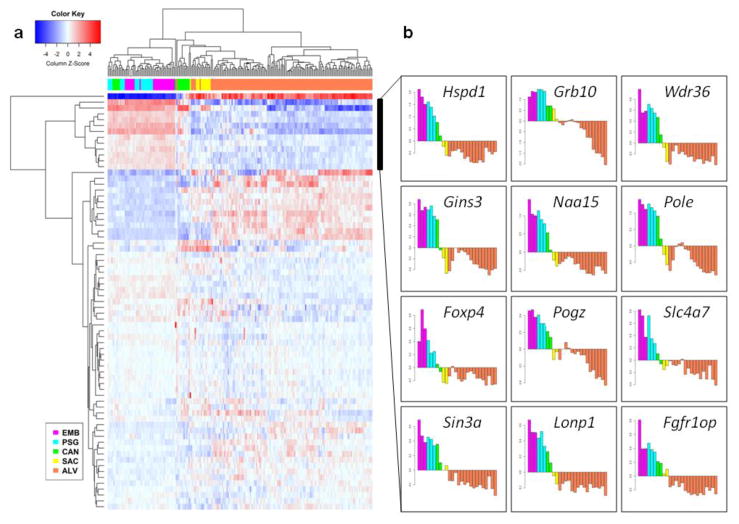
Fig. 3. Heatmap of lung expression data.
(a) The 71 genes with de novo sequence variants in CDH patients cluster in three groups according to gene expression in the mouse pre- and post-natal lungs. (b) Gene expression profiles throughout lung development are shown for each of the 12 genes with high expression in the embryonic lung, including the NAA15, HSPD1, POGZ, and SIN3A mouse orthologs. Each bar corresponds to a different time point in mouse development from E9.5 to P56. Stages in lung development are indicated by purple (embryonic), cyan (pseudoglandular), green (canalicular), yellow (saccular), and orange (alveolar). Normalization methods are as in (Beauchemin et al. 2016)

