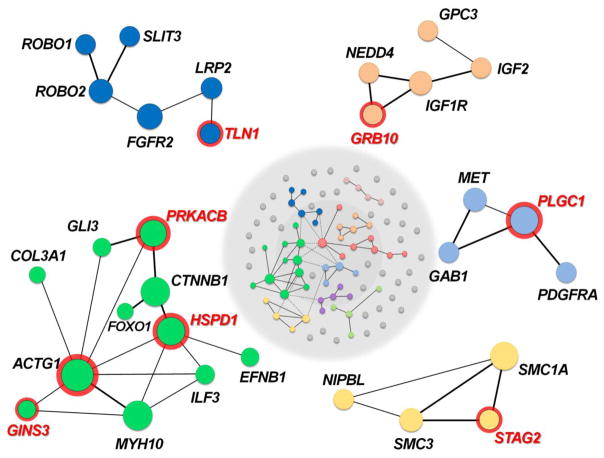
Fig. 4. Protein-protein network analysis.
Protein-protein interaction analysis based on the InWeb3 network (GeNets) revealed nine communities (center) of interacting gene products. Nodes represent CDH genes with genetic and functional evidence in Homo sapiens and/or Mus musculus, as well as candidate CDH genes with de novo mutations reported in this study. Communities with one or more de novo candidate genes (red) are magnified to provide greater detail. Larger circles indicate more central nodes. Thicker edges indicate interactions of the highest confidence, while dotted lines indicate interactions between nodes in different networks

