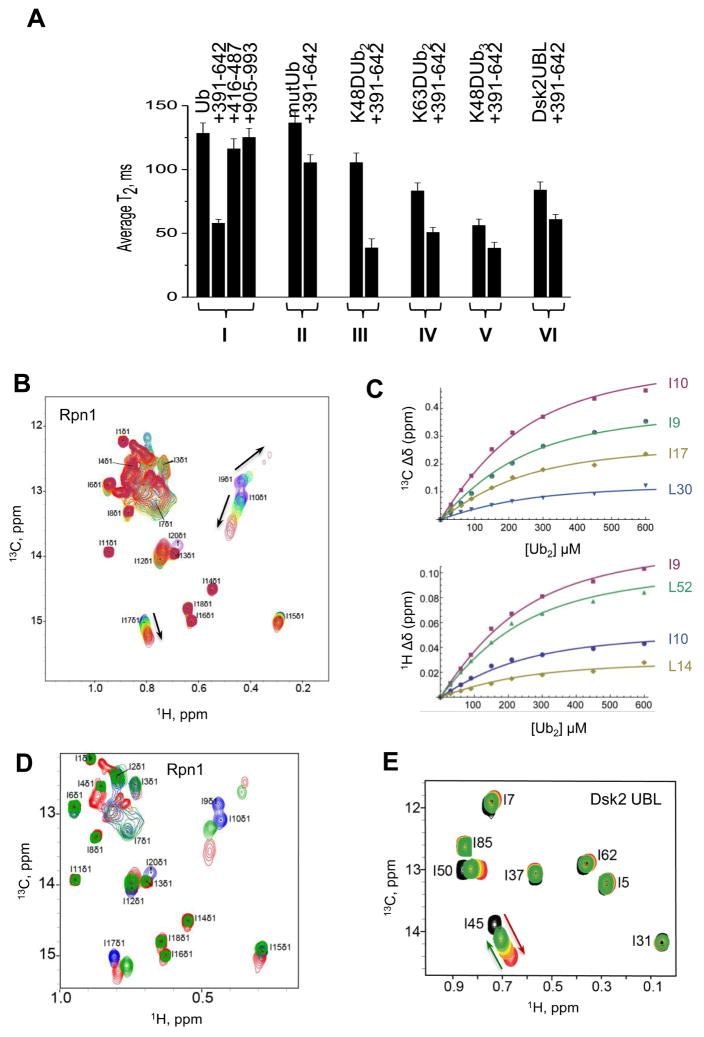
Figure 5.
Analysis of the competition between Ub or Ub2 and UBL domains for binding to Rpn1. (A) 15N T2 of backbone amides (averaged over secondary structure residues) for the following proteins (left to right): (I) monoUb alone and in the presence of Rpn1391–642 or Rpn1416–487 or Rpn1905–993, at 1:1 molar ratio; (II) Ub mutant (L8A, I44A) alone and in the presence of Rpn1391–642 at 1:1 molar ratio; (III) distal Ub of K48-Ub2 alone, and in the presence of Rpn1391–642 (at 1:1 molar ratio); (IV) distal Ub of K63-Ub2 alone and in the presence of Rpn1391–642 at 1:1 molar ratio; (V) distal Ub of K48-Ub3 alone and in the presence of Rpn1391–642 at 1:1 molar ratio; (VI) Dsk2UBL alone, in the presence of Rpn1391–642. (B) Overlay of 1H-13C HMQC spectra of 13CH3-ILVM-labeled perdeuterated Rpn1391–642 free (purple) and at various points in titration with K48-Ub2 (from dark blue to red, 3:1 molar ratio). Shown is the spectral region containing CH3-Ile δ signals; the Rpn1 signals are numbered arbitrarily; the arrows show the directions of signal shifts. (C) Representative titration curves for select CH3-Ile δ signals of Rpn1391–642 as a function of K48-Ub2 concentration, for 13C (top) and 1H (bottom) resonances. The solid lines represent the results of a global fit to a 1:1 binding model. The Rpn1 signals are numbered arbitrarily. The average KD values are summarized in Table 1. (D) Overlay of 1H-13C HMQC spectra of 13CH3-ILVM-labeled perdeuterated Rpn1391–642 in the absence (blue) and presence of K48-Ub2 (red) or Rad23UBL (green). Shown is the spectral region containing CH3-Ile δ signals; the Rpn1 signals are numbered arbitrarily. Rpn1 concentration was 250 μM, and Rad23 and K48-Ub2 were 500 μM each. (E) Overlay of 1H-13C HMQC spectra of 13CH3-ILVM-labeled perdeuterated Dsk2UBL alone (black), in the presence of 2H-Rpn1391–642 at 2:1 molar ratio (red) and upon subsequent additions of unlabeled K48-Ub2 up to 16-fold excess (green). At the end-point of titration, the concentrations are: [Rpn1] = 300 μM, [Dsk2] = 300 μM, [Ub2] = 4.8 mM. Shown is the spectral region containing CH3-Ile δ signals; the assignment of Dsk2UBL signals is from (Chen et al., 2008). The red and green arrows highlight the signal shifts upon addition of Rpn1391–642 and Ub2, respectively.

