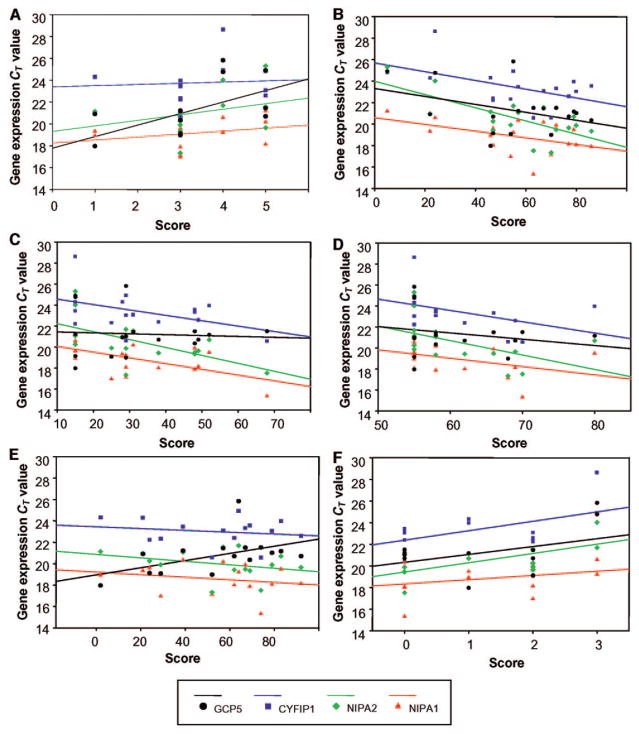
FIGURE 3.
Correlations of gene expression (based on CT values, which are inversely related to gene expression) for NIPA1, NIPA2, CYFIP1, and GCP5 and representative behavioral and cognitive parameters (A, SIB disruptive behavior frequency; B, Woodcock-Johnson math cluster; C, SIB broad independence score [standard score]; D, VMI [standard score]; E, reading comprehension; F, CBC if interrupted– other) between subjects with PWS with TI and TII deletions. Correlation values are provided in Table 2.

