
Figure 2.
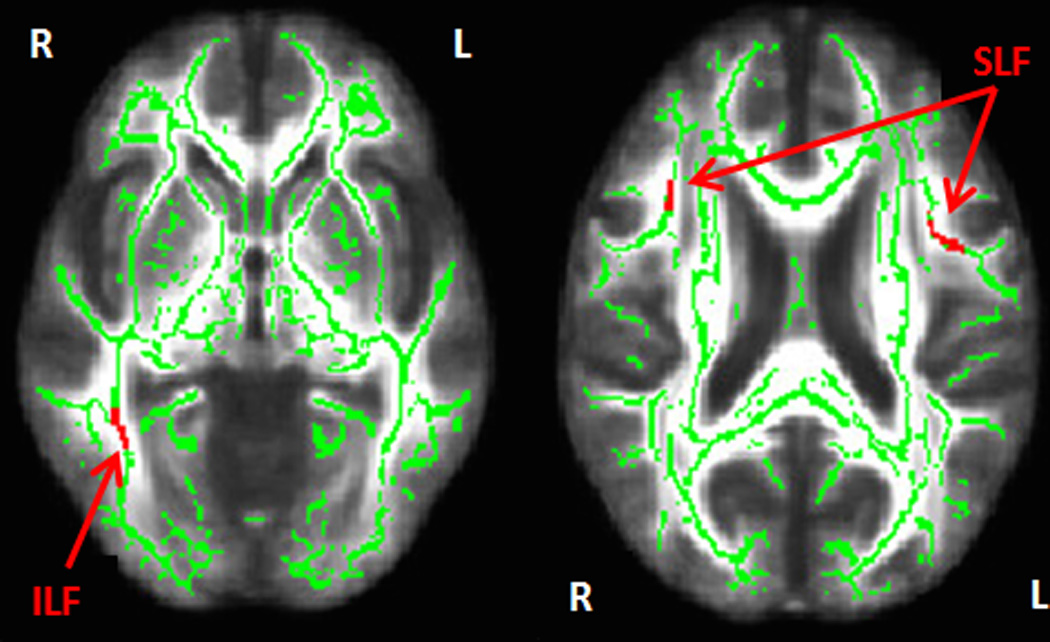
TBSS results in red overlayed on the mean white matter tract skeleton (in green) derived from FSL using non-parametric permutation testing and cluster-based thresholding correction (p<0.001, cluster size>100 voxels). Significant cluster voxels associated with GluDys and fractional anisotropy adjusted for age and sex are depicted by the arrows pointing to the right inferior longitudinal fasciculus (ILF) and the right and left superior longitudinal fasciculus (SLF).