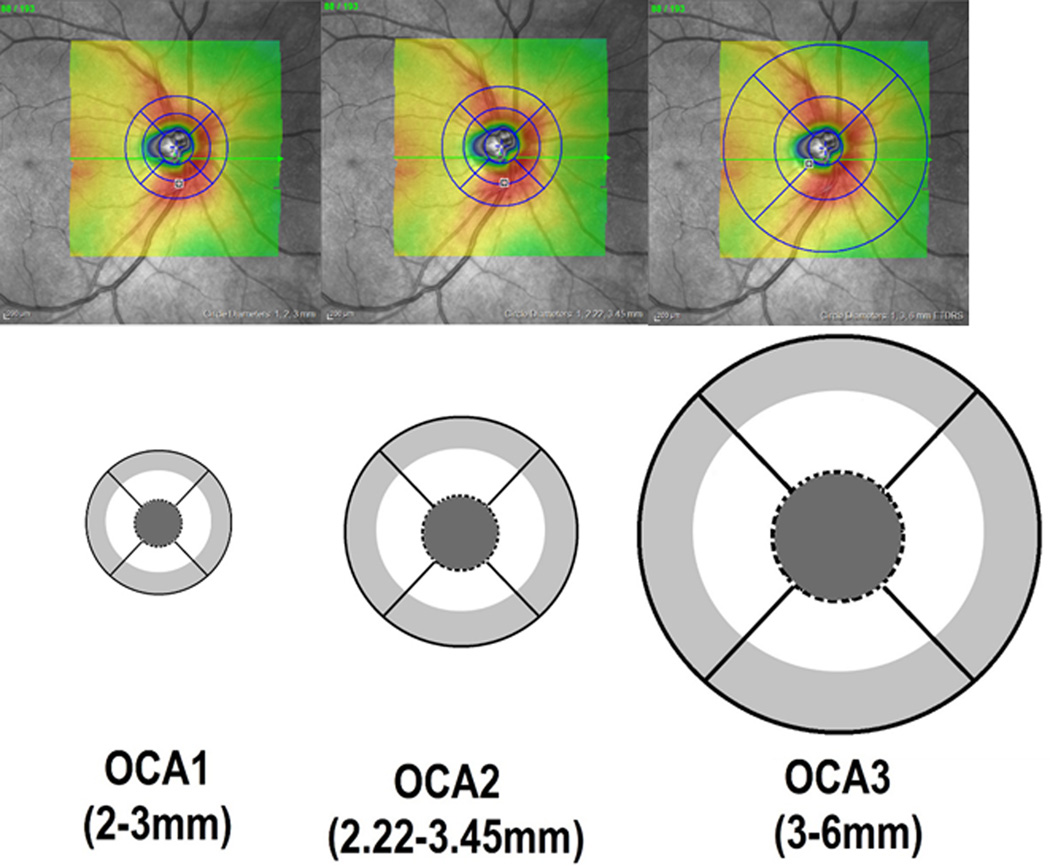
Figure 1.
Schematic representation and definition of the outer circumpapillary annuli (OCA1, OCA2, OCA3) of circular grids 1, 2 and 3. The upper row shows the infrared reflectance (IR) images of the optic nerve and peripapillary region In the IR images, the transparent colored areas which are centered over the optic nerve represent the 20×20 degree region scanned in the 3D volume scan. The blue circular grids are manually centered over the optic nerve from which the machine’s internal software generates the retinal volume values. Images in the lower row shows the diameters of OCA1,2,3 used in this study.

