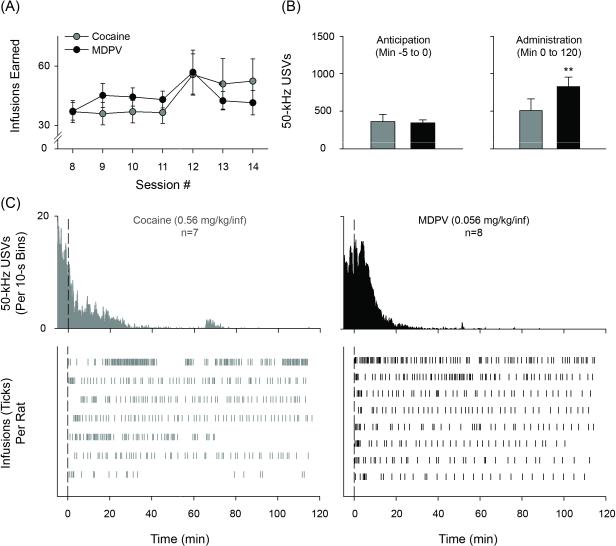
Figure 2.
Self-administration of cocaine or MDPV, whole session. (A) Number of infusions earned during second week of self-administration. Mean number of 50-kHz USVs during anticipation (B) or administration (C) of either cocaine (grey bars) or MDPV (black bars). (D, upper) 50-kHz USVs throughout 2-hours of drug self-administration in 10-s time bins. (D, lower) Drug infusion vertical line plots for individual rats. Vertical dashed line represents lever extension. ** p < 0.01 against respective anticipation data. Data in A, B and C are mean ± S.E.M. n's=7-8.

