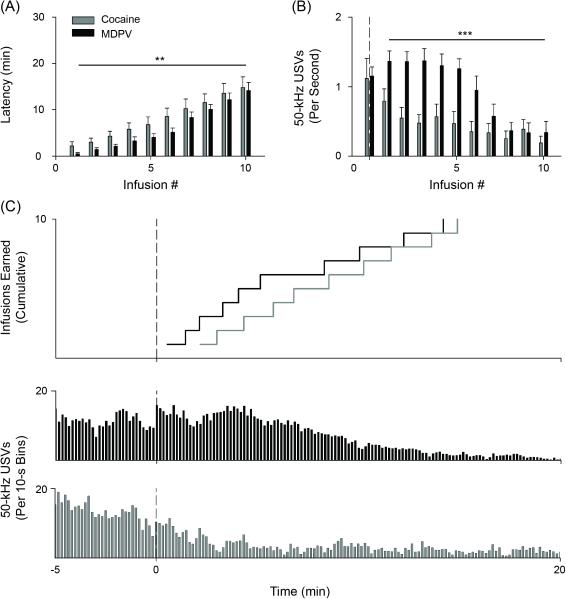
Figure 3.
Self-administration of cocaine or MDPV, load-up. (A) Latency to receive infusions 1-10 of cocaine (grey bars) or MDPV (black bars) relative to lever extension. (B) 50-kHz USVs per infusion where infusion “0” represents USV rate prior to infusion 1. (C, upper) Cumulative time to earn infusions 1-10 plotted using horizontal lines with corresponding 50-kHz USVs across anticipation and load-up (C, lower). Vertical dashed line represents lever extension. * p < 0.05, ** p < 0.01, *** p < 0.001 main effect of Drug Type. Data in A and B are mean ± S.E.M. n's=7-8.

