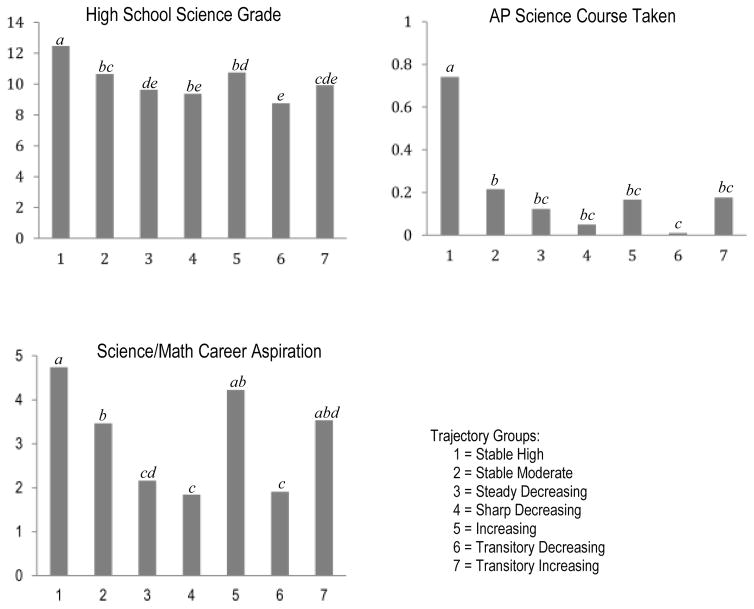
Figure 2.
Results of the multinomial logistic regression comparing outcomes of the ability self-concept and task values trajectory groups. Y-axis indicates the means of each outcome. X-axis indicates the trajectory groups. Means sharing the same superscript (indicated on the top of each bar) are not significantly different at the p < .05 level.

