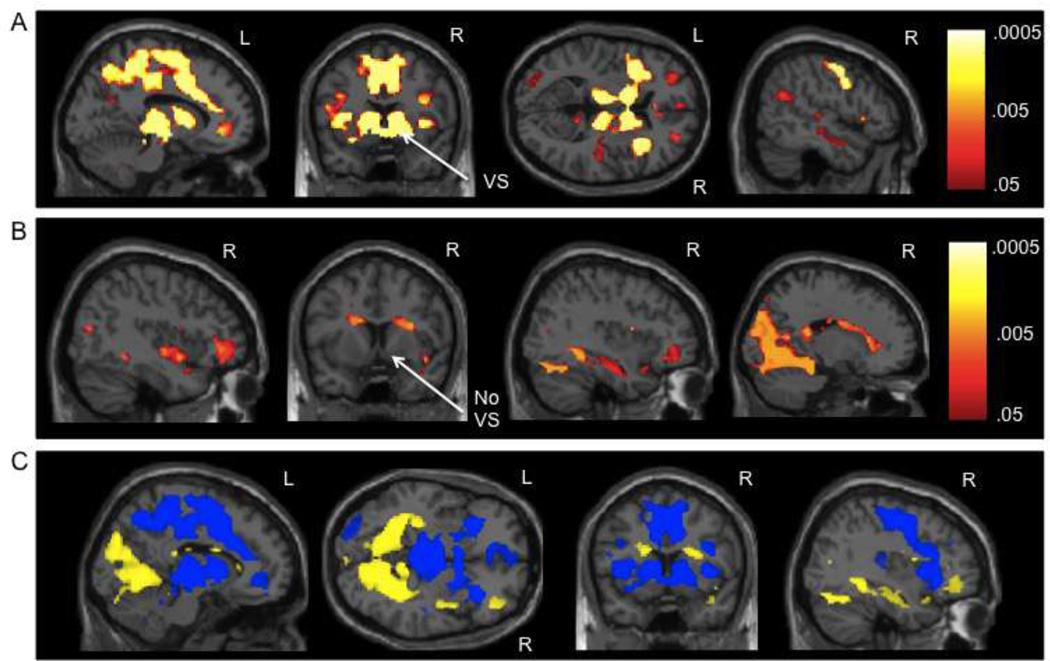
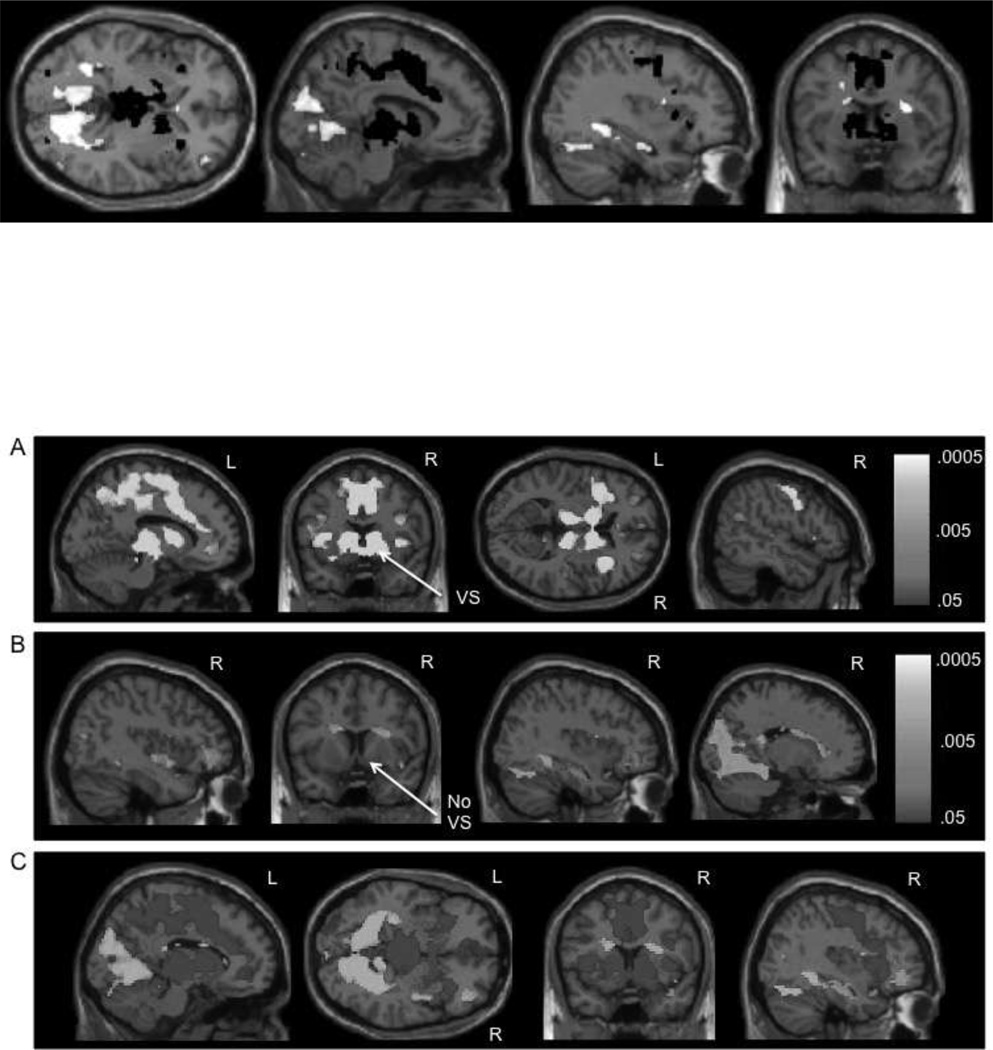
Figure 2.
A) Neural activation during reward anticipation vs. reward attainment. B) Neural activation during reward attainment vs. reward anticipation. For 2A and 2B, p-value maps from the permutation testing with threshold-free cluster enhancement analyses are presented; p-values are false discovery rate (FDR) corrected for multiple comparisons (p < .05). C) Depiction of the p-value maps from 2A and 2B overlaid on one another to show differences between the contrasts, with blue (dark gray) = reward anticipation vs. reward attainment and yellow (light gray) = reward attainment vs. reward anticipation. VS = ventral striatum


