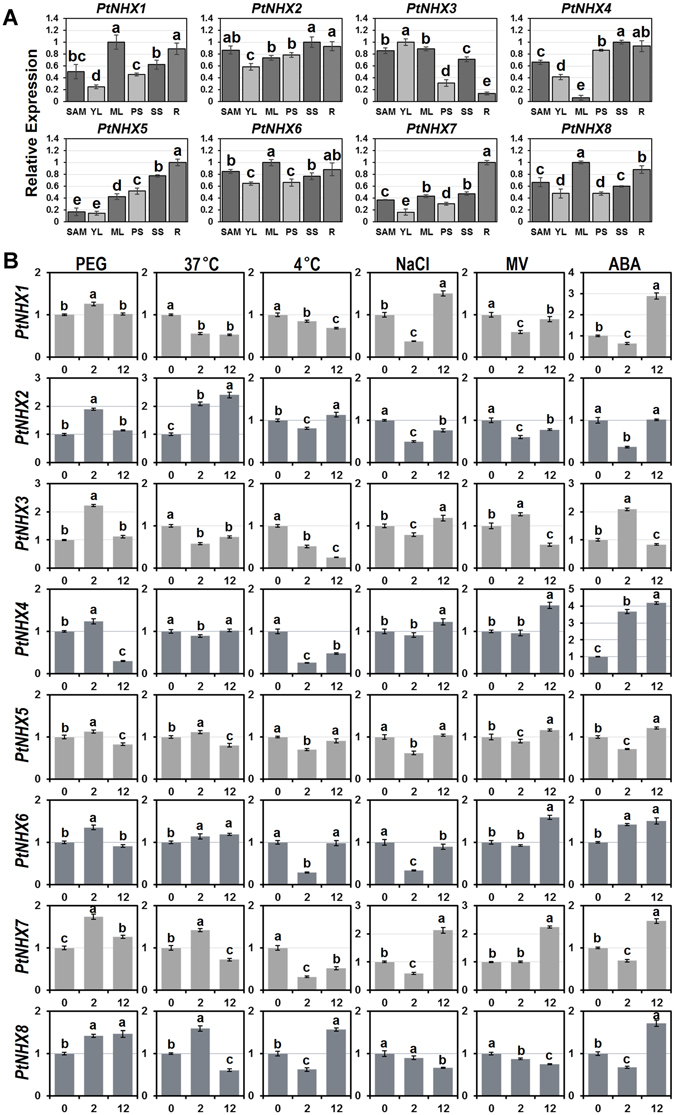
Figure 6.

Expression patterns of PtNHX genes in different tissues (A) and under various abiotic stresses (B) using qRT-PCR. (A) The relative mRNA abundance of the PtNHXs were quantified in six tissues (SAM–shoot apical meristems, YL–young leaves, ML–mature leaves, PS–primary stem, SS–secondary stem, R–roots). (B) The expression patterns of the PtNHXs at 2 and 12 hours after treated with drought (10% PEG), heat (37 °C), cold (4 °C), salt (150 mM NaCl), oxidative stress (100 μM MV) or 100 μM ABA. Bars with the same letters are not significantly (P < 0.05).
