Figure 2.

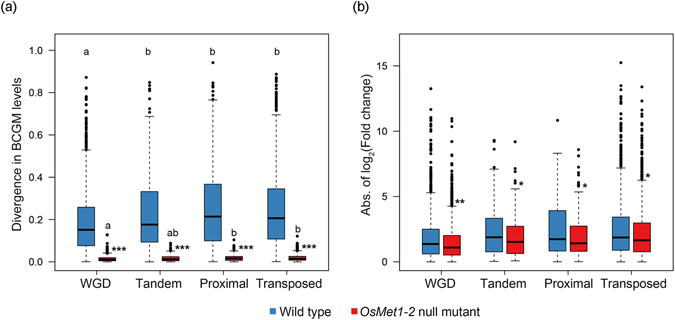
Divergence in body CG methylation (BCGM) level (a) and expression (b) between duplicated copies of each of the four different categories of duplicates with CG-only methylation in WT rice and the OsMet1-2 null mutant. The y axis in (a) denotes divergence in BCGM levels between duplicated copies of each duplication category. Pairwise comparisons showed significant differences in between-copy BCGM divergence among some (indicated by different small letters) but not all (indicated by the same small letters) of the four duplication categories in WT (ANOVA and Tukey’s honestly significant different (HSD) test, p < 2.42e-14). Significant reduction of between-copy divergence in BCGM was detected in mutant versus WT in all duplication categories (Kolmogorov-Smirnov test, p values < 0.001). The y axis in (b) shows absolute value of fold changes of between-copy expression levels of each duplication category in WT and mutant. Significant reduction of between-copy expression difference in mutant versus WT was detected for all categories of duplicated genes (Kolmogorov-Smirnov test, p values < 0.05).
