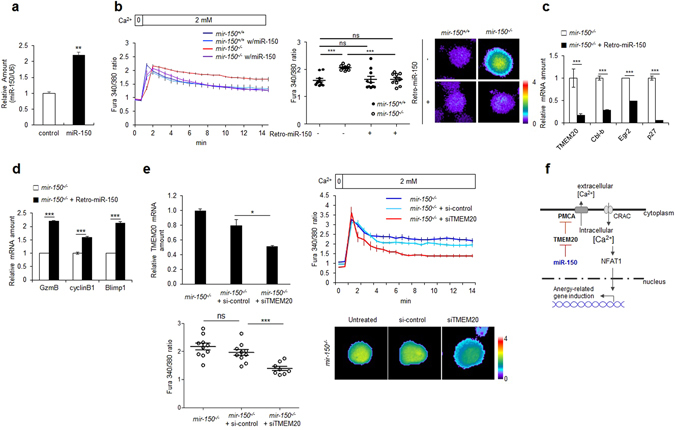
Figure 6.

Add-back of miR-150 rescues Ca2+ homeostasis and inhibits expression of anergy-related genes in mir-150 −/− naïve CD8+ T cells. (a) Isolated mir-150 +/+ naïve CD8+ T cells were infected with 10 MOI of retrovirus co-expressing miR-150 and GFP (retro-miR-150-gfp) and the miR-150 levels were analyzed. (b) Intracellular Ca2+ levels in retro-miR-150 transduced or control mir-150 +/+ or mir-150 −/− naïve CD8+ T cells (left). Dot graph shows intracellular Ca2+ levels at 15 min incubation (middle) and the representative images (right). (c) Expression levels of TMEM20 and anergy-related genes after add-back of miR-150 by transduction of retro-miR-150 in mir-150 −/− naïve CD8+ T cells. (d) Relative expression level of granzyme B, cyclinB1 and Blimp1 after stimulation using anti-CD3/CD28 in mir-150 −/− CD8+ T cells and retro-miR-150 infected mir-150 −/− CD8+ T cells. (e) TMEM20 mRNA amount (up left) and intracellular Ca2+ levels (up right) in siRNA for TMEM20 or control-siRNA transfected mir-150 −/− naïve CD8+ T cells (left). Dot graph shows intracellular Ca2+ levels at 10 min incubation (down left) and representative images (down right) (f) Schematic cartoon for the effect of miR-150 on Ca2+ homeostasis and induction of anergy-related genes in naïve CD8+ T cells. *P < 0.05, **P < 0.01, ***P < 0.001, ns: not significant.
