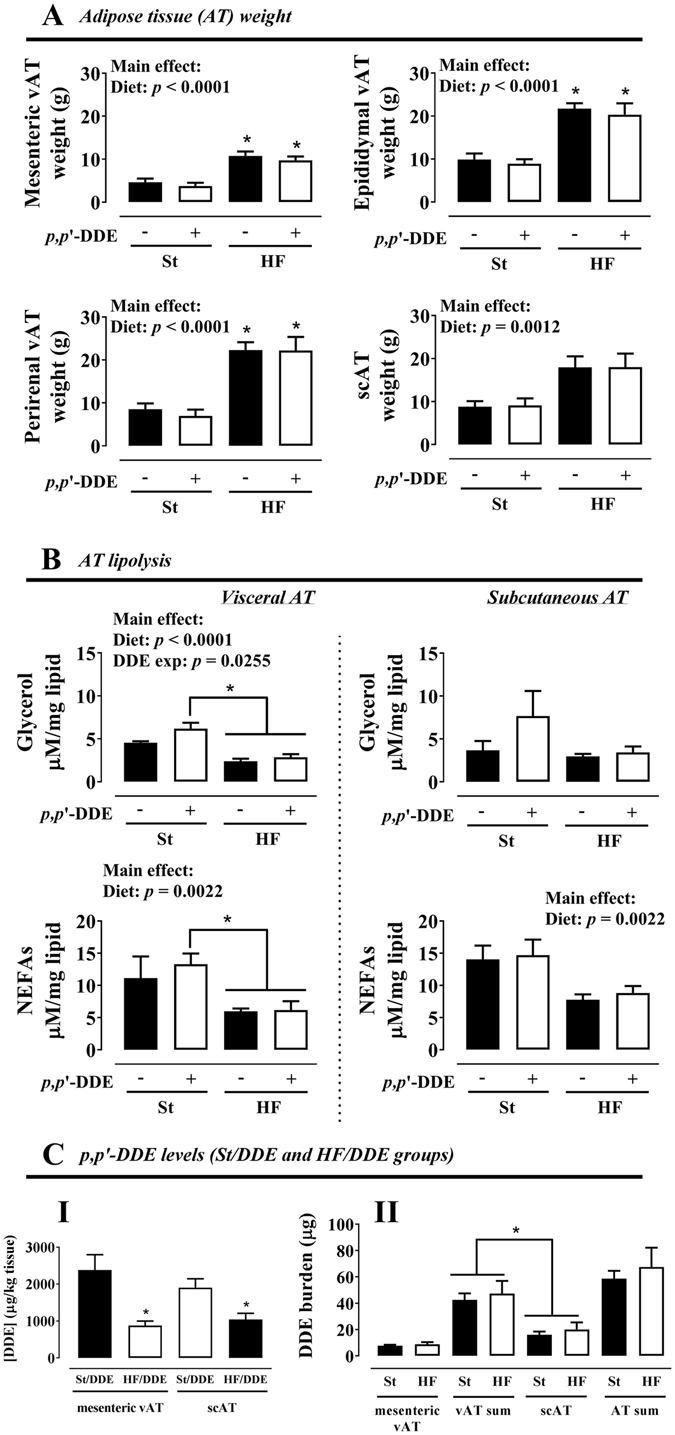
Figure 2.

Adipose tissue (AT) depot weight (A), lipolysis in isolated mature adipocytes (B) and p,p’-DDE levels in AT (concentration, CI; burden, CII), after 12 weeks. Values are represented as mean ± SEM. Statistical analysis with (A,B) two-way ANOVA (main effects: diet, p,p’-DDE exposure and their interaction; p < 0.05), followed by Tukey’s multiple comparison post-hoc test: *p < 0.05 vs St and/or St/DDE; (C) unpaired t test when comparing between treatment groups (St/DDE and HF/DDE) and paired t test when comparing between different ATs from the same treatment group: *p < 0.05. St, standard diet; HF, high fat diet; p,p’-DDE, p,p’-dichlorodiphenyldichloroethylene; vAT, visceral adipose tissue; scAT, subcutaneous adipose tissue; NEFAs, non-esterified fatty acids.
