Figure 5.

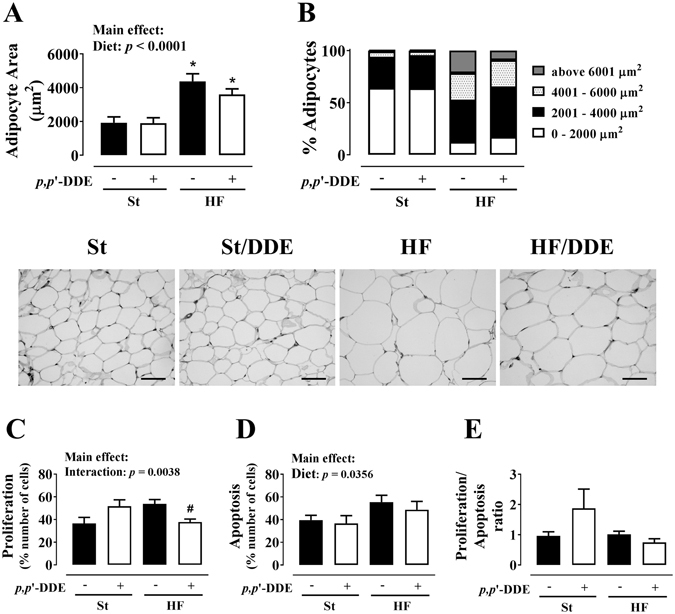
Mesenteric visceral adipose tissue morphology and proliferative and apoptotic status. (A) adipocyte area; (B) adipocyte distribution regarding their size; (C) proliferation; (D) apoptosis; (E) proliferation/apoptosis ratio. Statistical analysis with two-way ANOVA (main effects: diet, p,p’-DDE exposure and their interaction; p < 0.05), followed by Tukey’s multiple comparison post-hoc test: *p < 0.05 vs St; # p < 0.05 vs HF. Scale bar represents 200 μm. St, standard diet; HF, high fat diet; p,p’-DDE, p,p’-dichlorodiphenyldichloroethylene.
