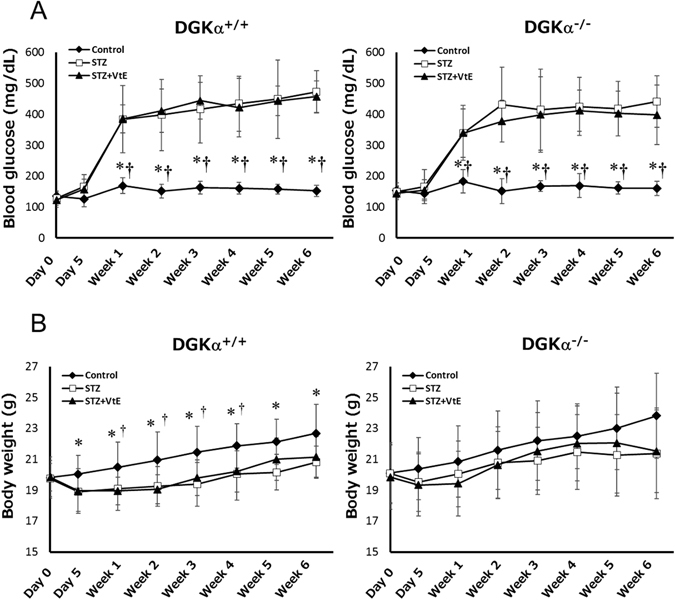
Figure 1.

Changes in blood glucose levels and body weight. The blood glucose levels (A) and body weight (B) of the mice in each group were measured before and after STZ administration (day 0 and day 5), and every week thereafter until 6 weeks. Number of the mice in each group: DGKα+/+ Control: n = 12~18, STZ: n = 13~20, STZ + VtE: n = 8~11, DGKα−/− Control: n = 12~18, STZ: n = 12~19, STZ + VtE: n = 9~11. *P < 0.01 vs. STZ; †P < 0.01 vs. STZ + VtE.
