
Figure 5.
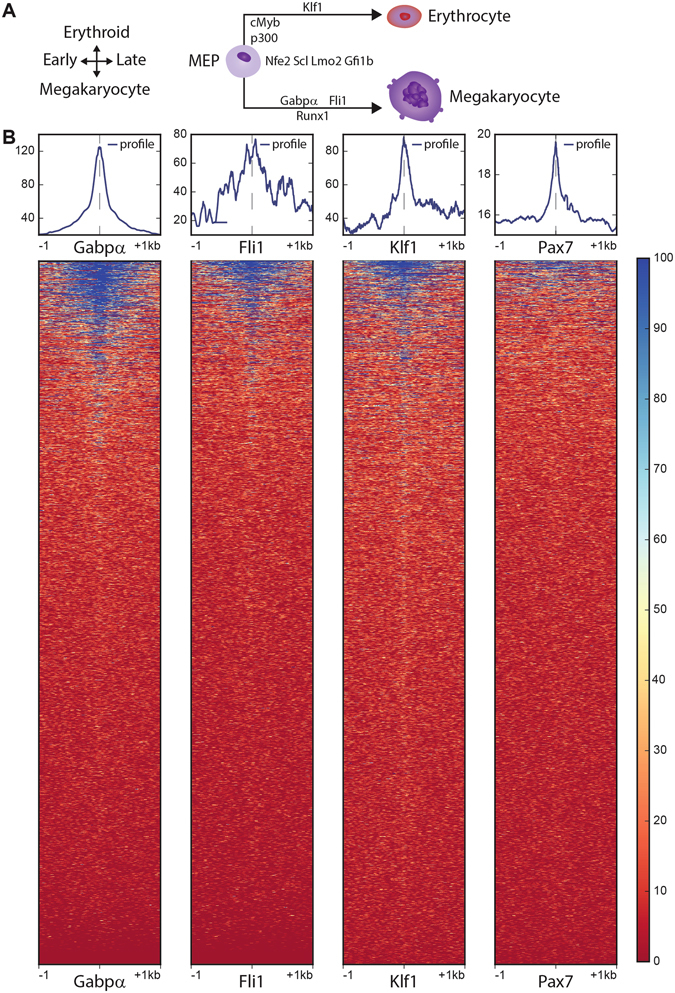
(A) Megakaryocyte differentiation, from left to right: Megakaryocyte progenitor cells (MPC) differentiate to erythrocytes (upper branch) or megakaryocytes (lower branch), while specific transcription factors for each branch drive the differentiation process (figure adapted from10). (B) Heatmaps on four in silico predicted transcription factor binding sites in the mm10 mouse genome assembly. Binding sites are located in the center, surrounded by the ATAC read signal from −1 kb to +1 kb. A globally normalized color scale represents the strength of the respective ATAC signal. The binding profile is shown at the top of each heatmap. Heatmaps from the left to the right represent Gabp-alpha, Fli1and Klf1 as Megakaryocyte progenitor specific transcription factors and Pax7 as Megakaryocyte unrelated factor.