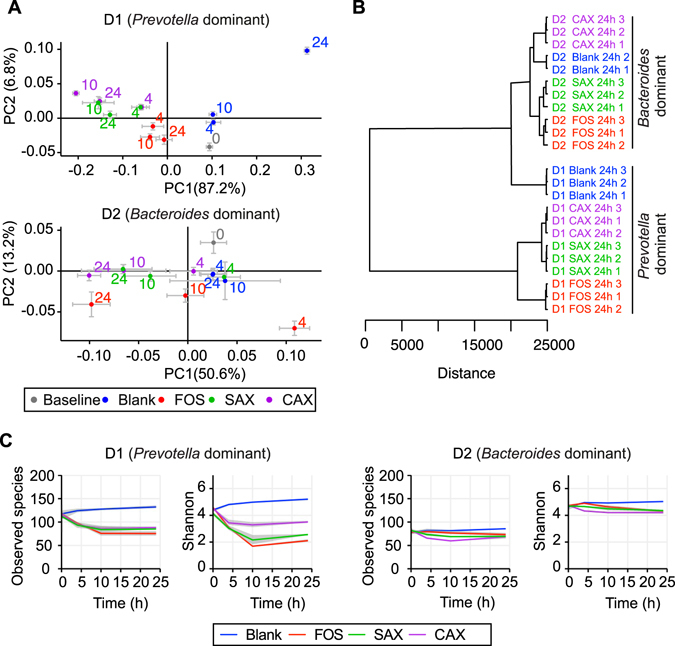
Figure 4.

Microbiota composition shift for D1 and D2 over the 24 h fermentation. (A) PCoA plot of jackknifed weighted UniFrac distance within the bacteria community shift under different treatments and times. Numbers by the symbols indicate fermentation time (h). Mean values ± SD are plotted. (B) Dissimilarity of microbiota after 24 h fermentation with each fiber. Samples were clustered using the Ward agglomerative algorithm on Euclidean distances. Distances were calculated using arbitrary units. (C) Observed species and Shannon diversity change over time.
