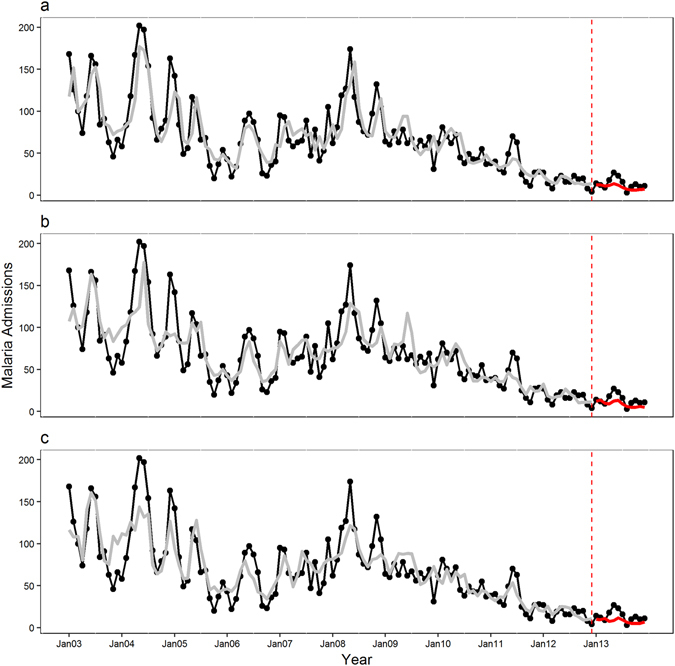
Figure 4.

Observed and predicted pediatric malaria admissions at Siaya district hospital, Western Kenya by prediction lead time for the period 2003–2013 from the GAM model. (a) The 1-month, (b) the 2-month and (c) the 3-month prediction lead times respectively. The black line displays observed malaria admissions, the grey line predicted values during the training period 2003–2012, and the red line the 2013 forecasted values. The dotted red line marks the beginning of the test period.
