
Figure 2.
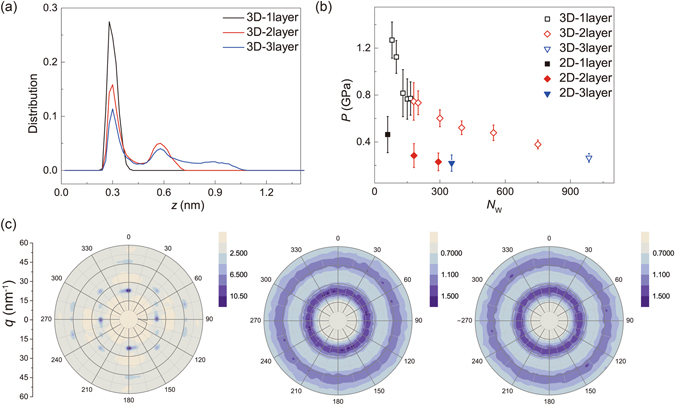
(a) Density profiles at 300 K, measured along the z direction of encapsulated water in the 3D model, with N W = 115, 546 and 986 for 1, 2 and 3 layers. (b) Pressure in the water condensation plotted as a function of the number of water molecules at T = 300 K. (c) In-plane structure factors of nanoconfined mono-, bi- and tri-layer water with N W = 115, 546, 986 at T = 300 K. The error bars are obtained from the thermodynamic fluctuations measured in MD simulations. Here the wave vector q is represented as its amplitude q and orientation in the polar plots. The color denotes the amplitude of structure factor S(q).