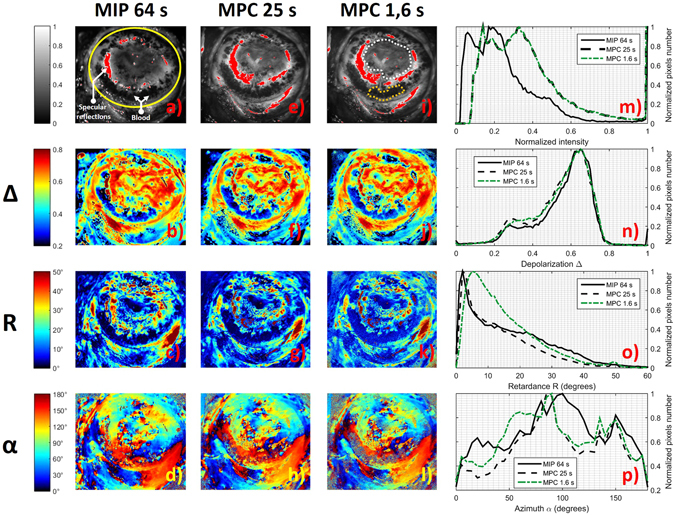
Figure 3.

Comparison of intensity and polarimetric images obtained with the MIP and the MPC on the ex vivo uterine cervix shown in Fig. 2. (a–d) MIP Intensity image and polarimetric images of Depolarization (Δ), Retardance (R) and Azimuth (α) respectively for an acquisition time of 64 s. (e–h) the same parameters acquired by the MPC for an acquisition time of 25 s. (i–l) the same parameters acquired by the MPC for an acquisition time of 1.6 s. (m–p) histograms of Intensity, Depolarization, Retardance and Azimuth images respectively for both instruments at different acquisition times. All the histograms were calculated inside the ROI delineated by the yellow line in Fig. 3(a). White and orange dotted lines in Fig. 3(i) delimit two different areas that will be analyzed more in detail in Fig. 4.
