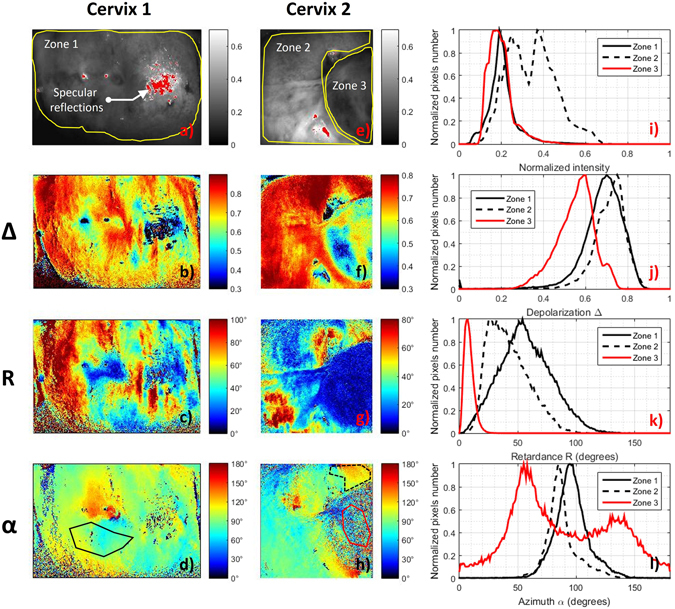
Figure 6.

Comparison between intensity and polarimetric images of the in vivo uterine cervices shown in Fig. 5. (a–d) MPC intensity image and polarimetric images of Depolarization (Δ), Retardance (R) and Azimuth (α) respectively, for Cervix 1; (e–h) the same parameters for Cervix 2. Corresponding histograms of Intensity, Depolarization, Retardance and Azimuth images for both samples are plotted in the Fig. 6(i–l) respectively. Histograms were calculated inside the three ROI delineated by the yellow solid lines in Fig. 6(a,e) (Zone 1, Zone 2 and Zone 3). Red line in Fig. 6(h), solid and dotted black lines in Fig. 6(d,h) delineate three areas that will be analyzed more in detail in Fig. 7.
