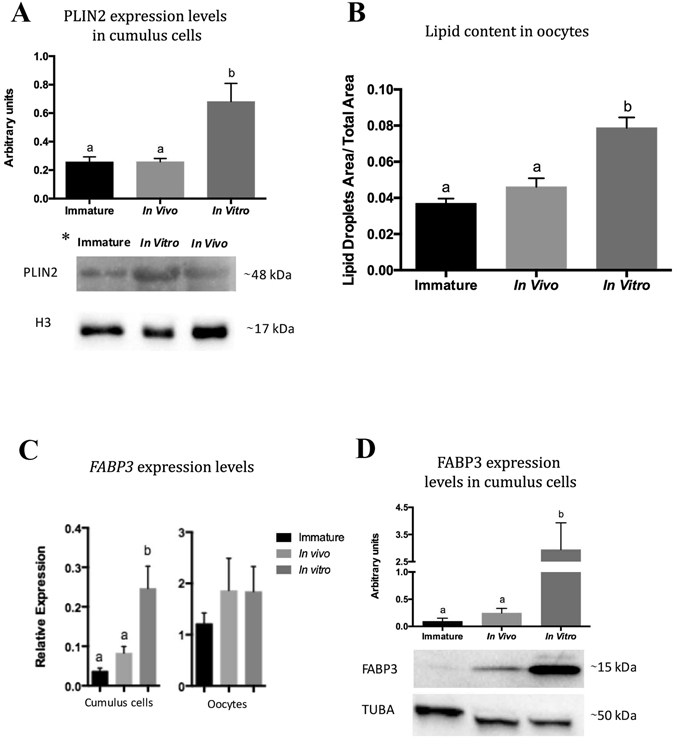
Figure 1.

Quantification of lipid content in cumulus cells and oocytes derived from immature, in vivo-matured and in vitro-matured cumulus-oocyte complexes (COCs). (A) Lipid content in cumulus cells was determined by western blot analysis of perilipin 2 (PLIN2) using histone 3 (H3) as a normalizer. (B) Lipid quantification in oocytes was performed by fluorescence confocal microscopy of lipid droplets. The values for lipid content represent the ratio of area of lipid droplets to total oocyte area. Representative immature, in vivo-matured and in vitro-matured oocytes stained with BODIPY 493/503 are shown in Supplementary Fig. S1. (C) Relative amounts of fatty acid binding protein 3 (FABP3) transcripts in immature, in vivo-, and in vitro- matured cumulus cells and oocytes. (D) FABP3 protein levels in cumulus cells normalized by x-Tubulin (TUBA). Lowercase letters above bars in the same graph indicate significant differences (P < 0.05). Values are presented as mean ± standard error of the mean. The full western blot images in (A) and (D) are shown in Supplementary Fig. S2a and S2b, respectively. *The order of the groups is different between the graph and the representative immunoblot images.
