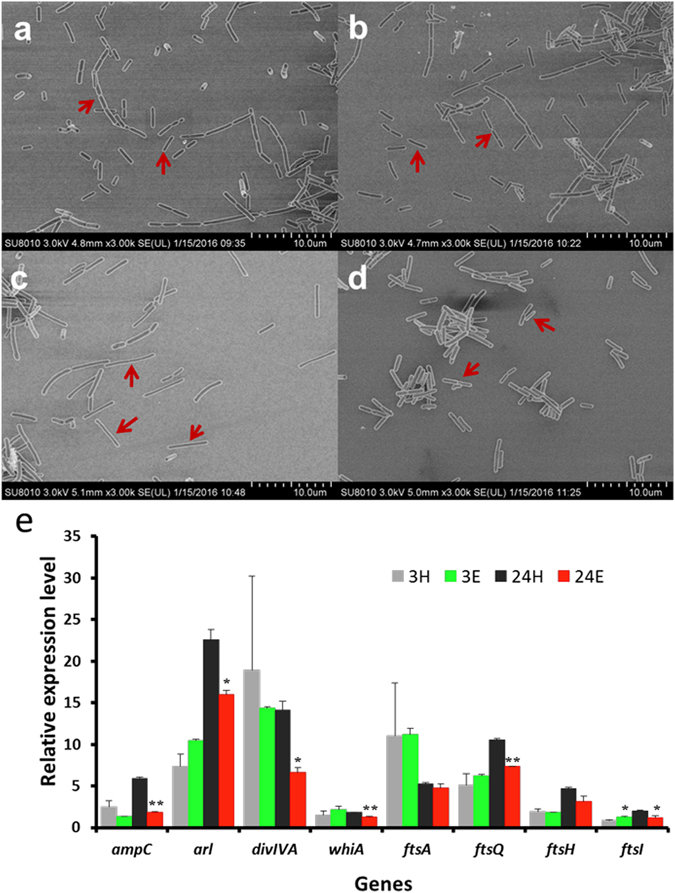
Figure 7.

SEM analysis of L. acetotolerans F28 grown under the stress of 12% (v/v) ethanol. (a) Cell morphology of L. acetotolerans F28 after ethanol treatment for 3 hours. (b) Cell morphology of L. acetotolerans F28 after water treatment for 3 hours (control). (c) Cell morphology of L. acetotolerans F28 after ethanol treatment for 24 hours. (d) Cell morphology of L. acetotolerans F28 after water treatment for 24 hours (control). (e) The relative expression level of genes related to cell division in L. acetotolerans F28 by qRT-PCR. 3 H: samples of 3 hours after 12% water treatment (control), 24 H:samples of 24 hours after 12% water treatment (control), 3E:samples of 3 hours after 12% ethanol treatment, 24E:samples of 24 hours after 12% ethanol treatment. Each sample was tested in triplicate. *Values and standard deviation are calculated from at least three independent experiments performed in triplicate. Significance was determined by Student’s t test. *indicated the significance of p < 0.05 and **indicated the significance of p < 0.01.
