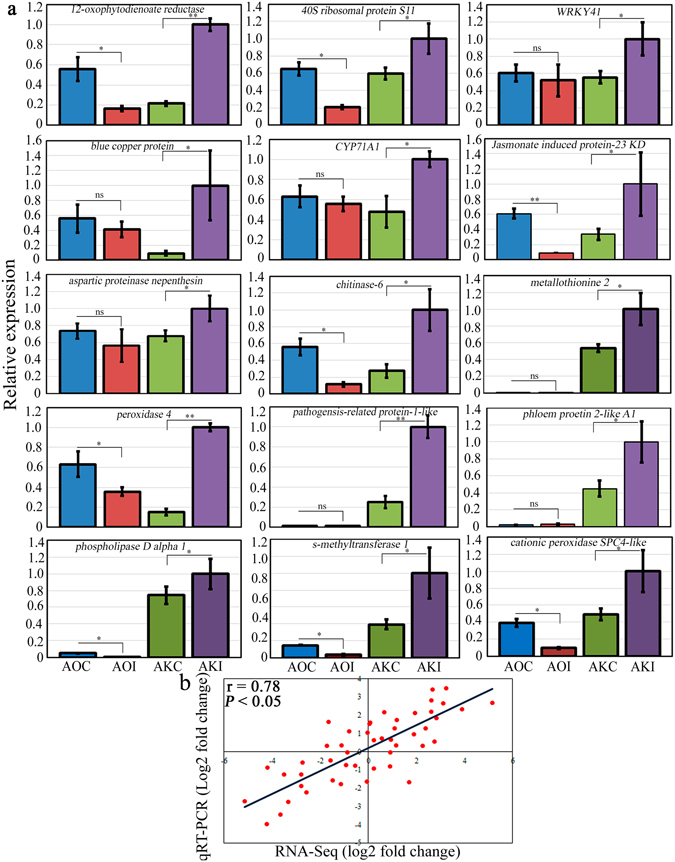
Figure. 6.

Validation of RNA-Seq data with quantitative real-time reverse transcription PCR (qRT-PCR). (a) Bar plot of qRT-PCR relative expression in Asparagus kiusianus and A. officinalis treated with distilled water (AKC and AOC, respectively) and inoculated with Phomopsis asparagi (AKI and AOI, respectively). (b) Scatter plot correlation between qRT-PCR and RNA-Seq log2 fold changes (Pearson’s correlation coefficient = 0.78). Values represent the mean on three independent biological replicates (n = 3) ± standard deviation (SD). Significance levels are given as: *(P < 0.05) and **(P < 0.01) and according to analysis of variance (ANOVA).
