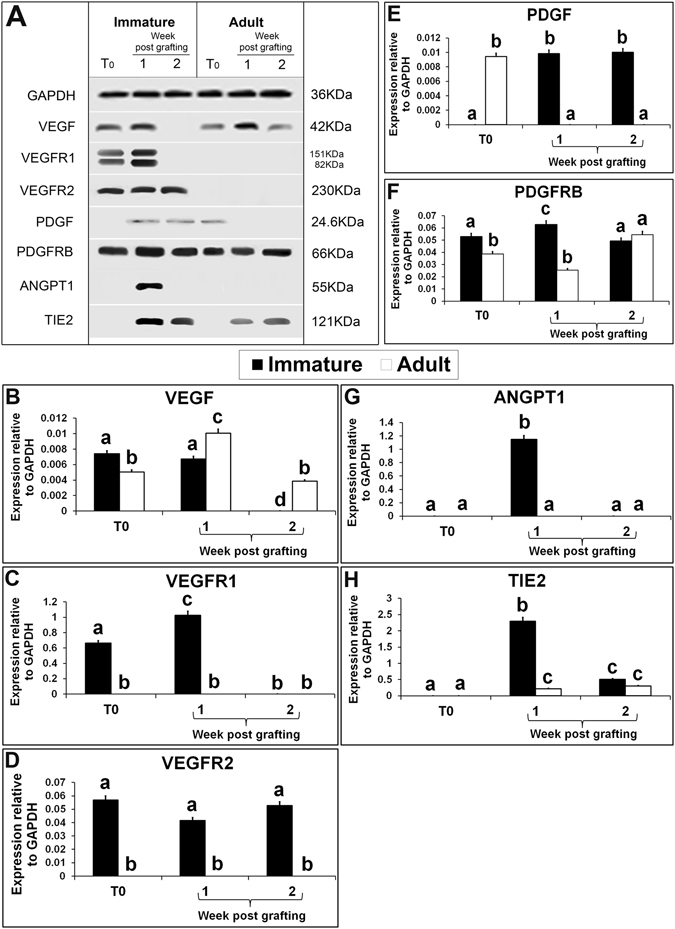
Figure 3.

Western blot analysis of xenografted immature and adult testes at 1-and 2-wk-post grafting for expression of growth factors and their receptor-specific proteins. Protein expression in 6-day-old and 10-wk-old donor testes before grafting (T0) are presented as starting material. Representative blot (A) and densitometry analysis of (B) VEGF, (C) VEGFR1, (D) VEGFR2, (E) PDGF, (F) PDGFRB, (G) ANGPT1, and (H) TIE2 protein. Y-axis represents intensity of bands relative to GAPDH. Data are presented as mean ± SEM. Bars with different letters are significantly different at P < 0.05.
