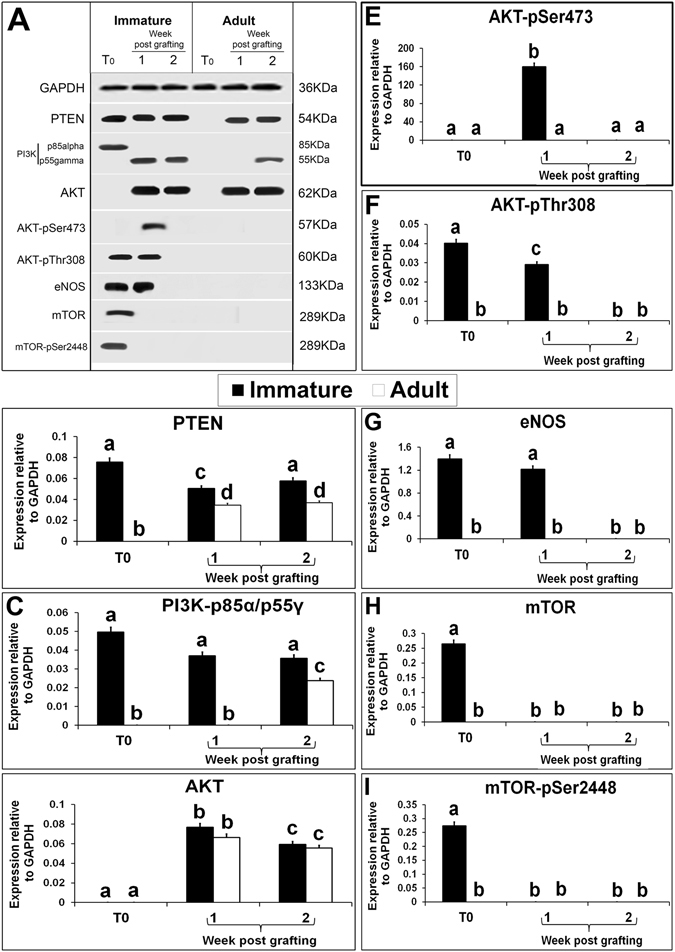
Figure 6.

Western blot analysis of xenografted immature and adult testes at 1-and 2-wk-post grafting for expression of PI3K/AKT/mTOR pathway proteins. Protein expression in 6-day-old and 10-wk- old donor testes before grafting (T0) are presented as starting material. Representative blot (A) and densitometry analysis of (B) PTEN, (C) PI3Kp85alpha/gamma-pY467/199, (D) AKT, (E) AKT-pSer473, (F) AKT-pTyr308, (G) eNOS, (H) mTOR and (I) mTOR-pSer2448 protein. Y-axis represents intensity of bands relative to GAPDH. Data are presented as mean ± SEM. Bars with different letters are significantly different at P < 0.05.
