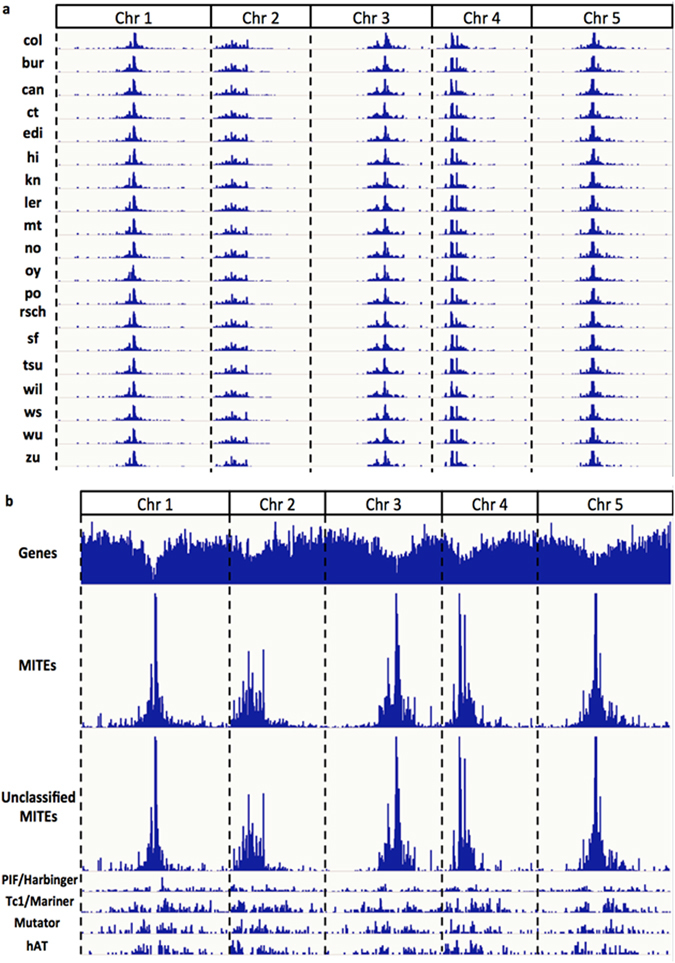
Figure 3.

MITE distributions along the five chromosomes in Arabidopsis thaliana. (a) Relative locations and abundances of MITEs in all 19 accessions. (b) The comparison of the distributions of different MITE superfamilies in col. The top track shows the gene density along 5 chromosomes (Chr1 to Chr5), where troughs indicate heterochromatic centromere regions. The second top track represents the distribution of the MITE population along chromosomes. Depending on whether a specific MITE sequence was defined previously or not, MITEs are categorized into unclassified and classified MITEs, and classified MITEs are further grouped into four super-families (i.e., PIF/Harbinger, Tc1/Mariner, Mutator and hAT) based on their sequence characterizations. The distributions of MITEs in the four superfamilies are displayed in the rest of the tracks respectively.
