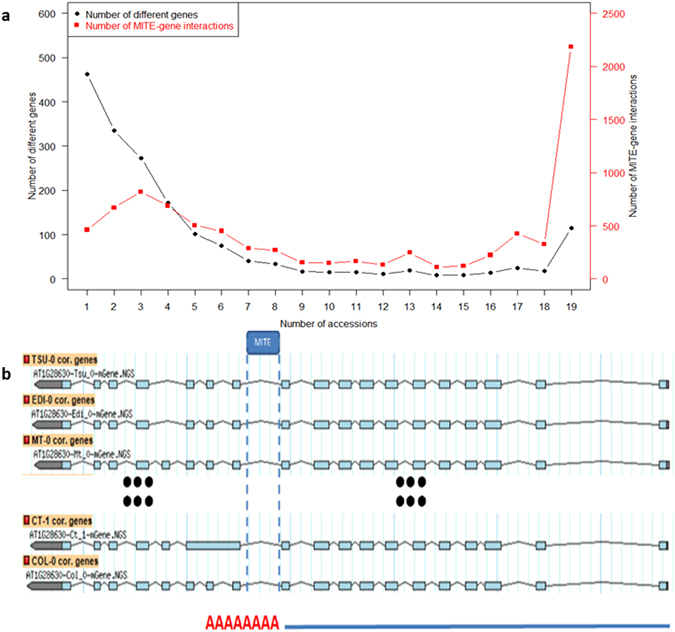
Figure 4.

Summary of the MITE-gene interactions. (a) The shared MITE-gene interaction in 19 Arabidopsis accessions. The X-axis represents the number of different accessions that share the same MITE-gene interaction. The left Y-axis (black) represents the number of MITE-related genes. The MITE-related genes are defined as those that contain or are adjacent to the same MITEs in at least one accession. The right Y-axis (red) presents MITE-gene interaction values, which are defined and quantified as the production of multiplying the number of MITE-related genes with the number of accessions having the same MITE-related genes. For instance, the first MITE-gene interaction value is 462 (weak interaction), which means there are 462 MITE-related genes present only in one accession. The last MITE-gene interaction value is 2185 (strong interaction), which means there are 115 MITE-related genes common in all 19 accessions. (b) The snapshot of MITE-gene interactions associated with gene AT1G28630.
