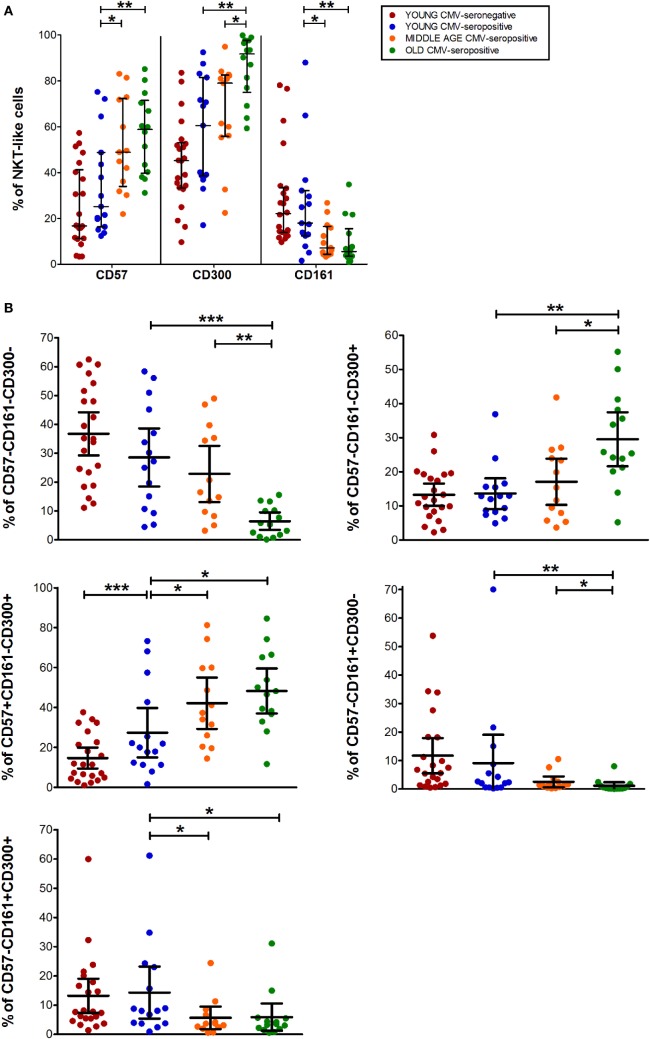
Figure 4.
CD57, CD300, and CD161 expression on NTK-like cells. (A) Total expression (percentage) of CD57, CD161, and CD300a markers on NKT-like cells from young CMV-seronegative (n = 22), young CMV-seropositive (n = 15), middle age CMV-seropositive (n = 13), and old CMV-seropositive donors (n = 14). (B) Co-expression of CD57, CD161, and CD300a on NKT-Like cells. Graphs show the markers combinations in which we found statistical differences among the four groups studied. Vertical black lines indicate interquartile ranges, ranging from the 25th to the 75th percentile. The median values are indicated by a horizontal black line. Results were considered significant at *p < 0.05, **p < 0.01, and ***p < 0.001.

