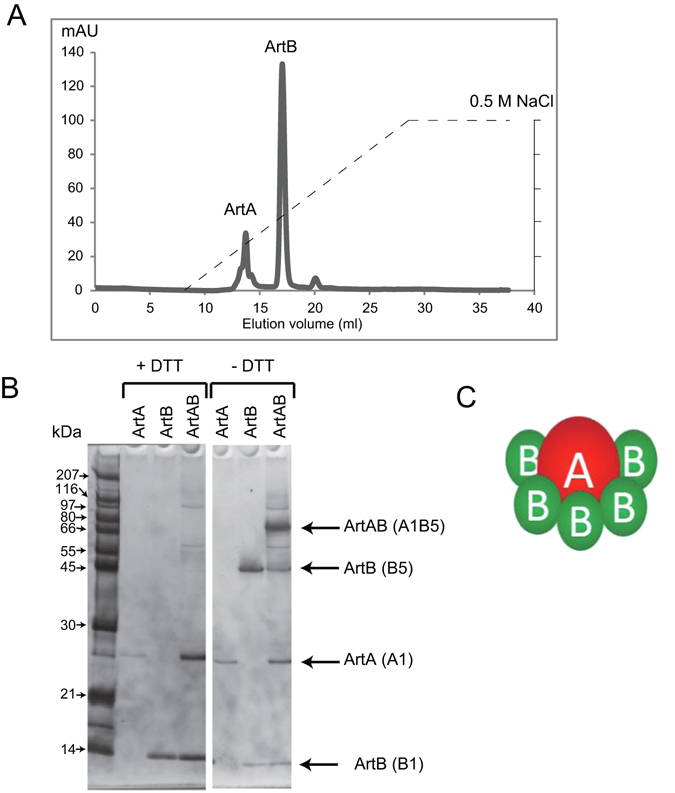
Figure 2.

ArtA and pentameric ArtB subunits of ArtAB. (A) Separation of ArtA and ArtB by Mono-Q anion exchange chromatography. The dashed line shows the increasing salt gradient (0 to 0.5 M NaCl in 30 mM Tris-HCl, pH 8.8). (B) SDS-PAGE analysis of the protein content of the ArtA and ArtB chromatographic fractions obtained by Mono-Q anion exchange chromatography. The gel was stained using a silver staining kit. These along with purified ArtAB were separated by electrophoresis in the presence or absence of 100 mM DTT. Molecular weight standards (kDa) are indicated on the left; positions of the toxin subunits are indicated on the right. (C) Schematic illustration of ArtAB subunit structure.
