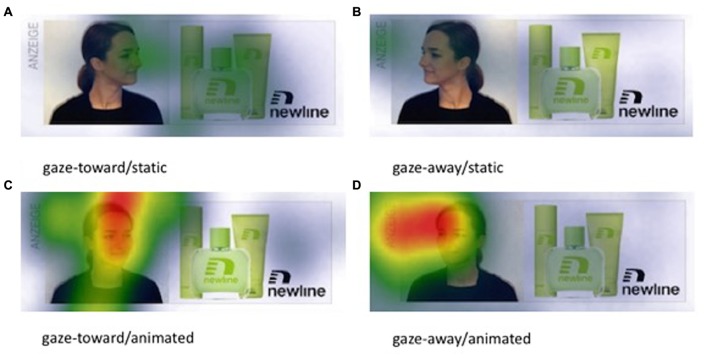
FIGURE 6.
Heat maps showing the accumulated time participants spent looking at different areas of the banner advertisement for the four experimental conditions (A–D) summarized across all participants who initially gazed at the banner advertisement. Images are scaled by fixation duration relative to all other elements of the web page and display a 3-color coding ranging from blue (min. fixation duration) to red (max. fixation duration).

