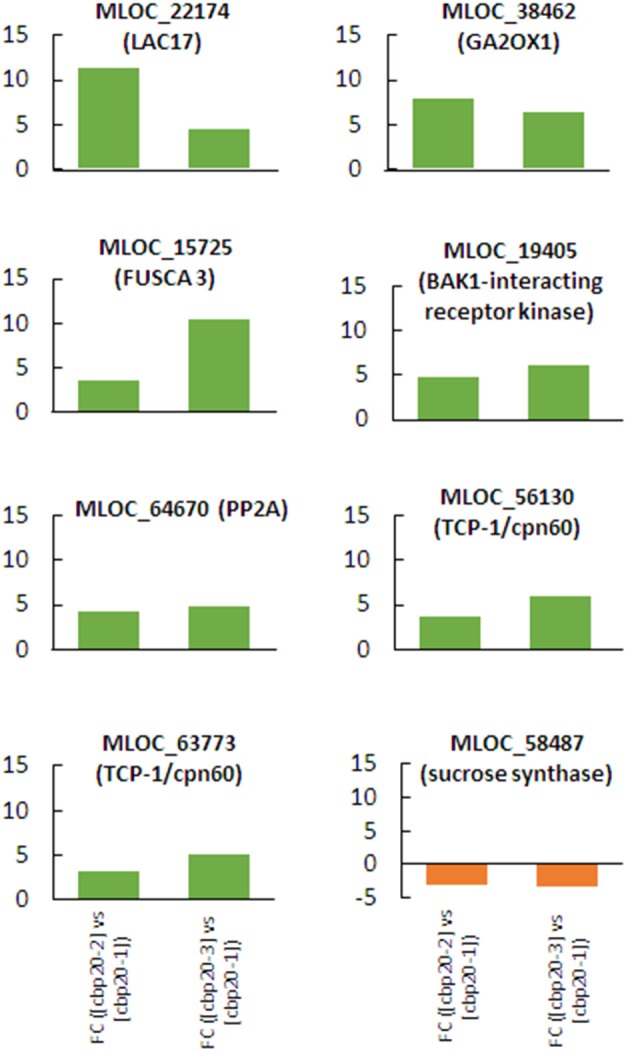
Figure 11.

The profiles of expression of selected genes that exhibited the same pattern of expression (up- or down-regulation) during all phases of drought experiment in hvcbp20.ab.

The profiles of expression of selected genes that exhibited the same pattern of expression (up- or down-regulation) during all phases of drought experiment in hvcbp20.ab.