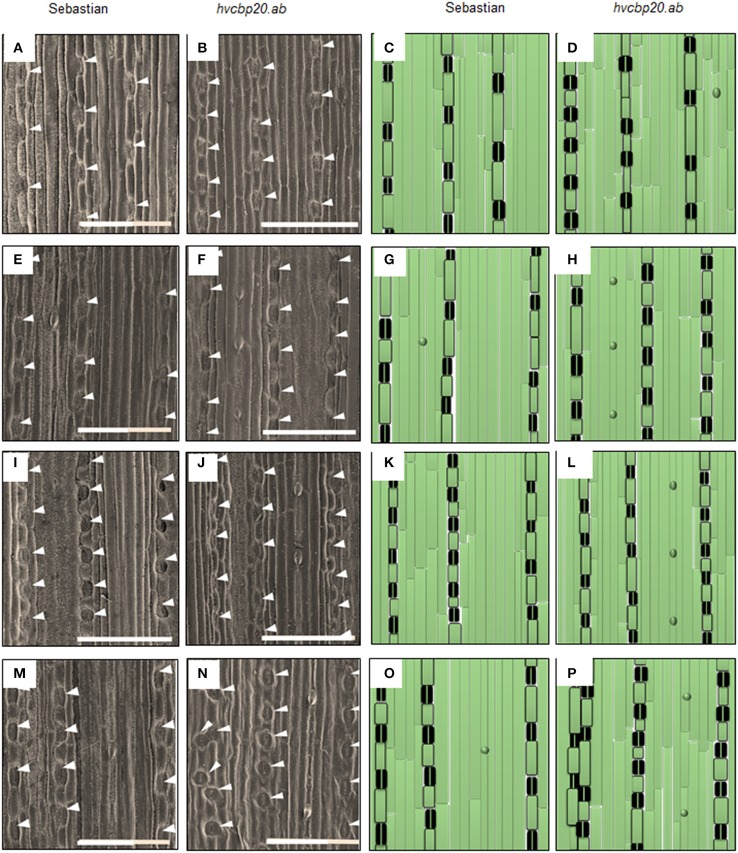
Figure 7.
Epidermal pattern in “Sebastian” and hvcbp20.ab. (A–D) Epidermal pattern on abaxial surface of the leaf in control conditions; (E–H) Epidermal pattern on abaxial surface of the leaf after 10 days of drought treatment; (I–L) Epidermal pattern on adaxial surface of the leaf in control conditions; (M–P) Epidermal pattern on adaxial surface of the leaf after 10 days of drought treatment. The microscopic analysis was performed using SEM (UHR FE-SEM Hitachi SU 8010) under the 100x magnification. Analysis was performed in three biological replicates (three leaves of each genotype studied). The size of analyzed field was 1 mm2 and 50 images of the same part of each of the three leaf blades were analyzed per genotype. The bar = 200 μm.

