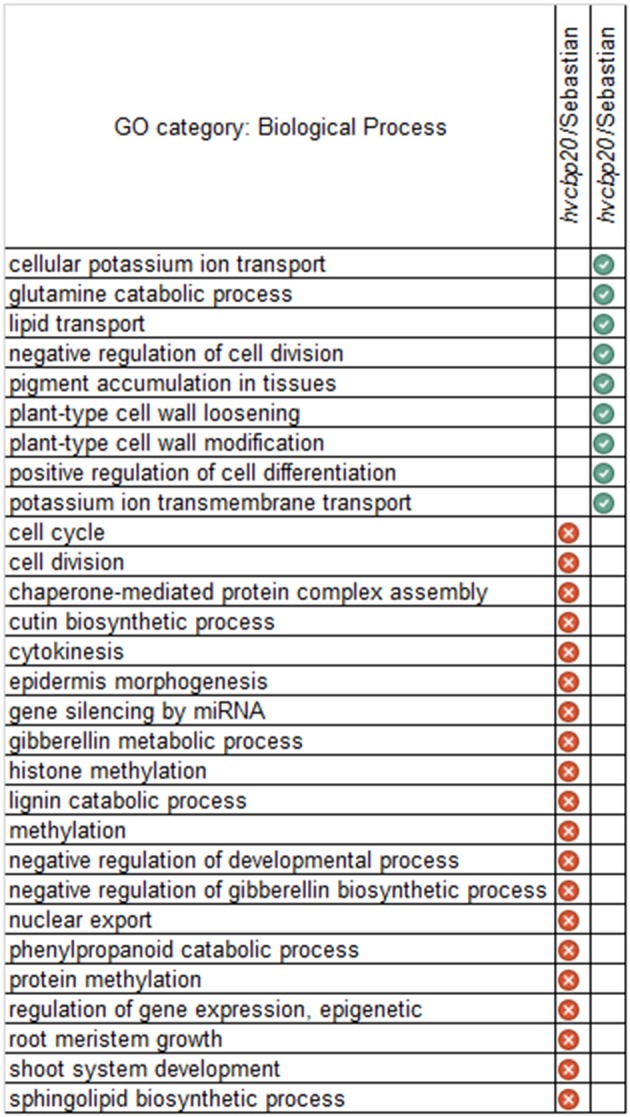
Figure 8.

GO categories (Biological Processes) that were over-represented in the hvcbp20.ab mutant when compared to the “Sebastian” in control conditions. BPs that were over-represented in the subsets of genes: down-regulated genes are indicated by a white “x” inscribed in a red circle and up-regulated genes are indicated by a white tick inscribed in a green circle (corrected P < 0.01).
