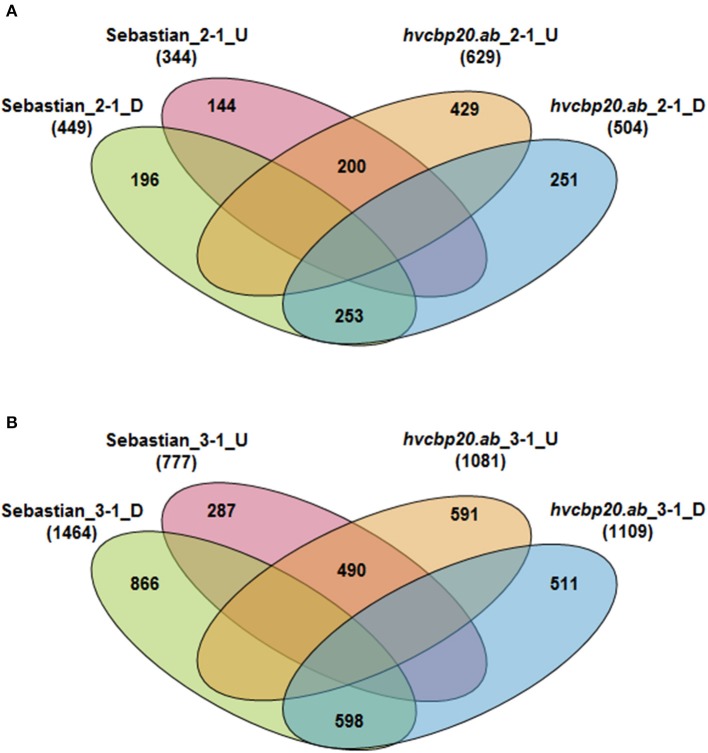
Figure 9.
Comparative analysis of the numbers of DEGs during the drought experiment in the WT cv. “Sebastian” and the hvcbp20.ab mutant. (A) Comparative analysis of the number of DEGs at the onset of drought stress. (B) Comparative analysis of the number of DEGs after prolonged drought stress. In the Venn diagrams, the subsets of the genes that were up-regulated or down-regulated specifically in “Sebastian” or the hvcbp20.ab mutant during the subsequent stages of the experiment in comparison with the control conditions are indicated (P ≤ 0.05 after FDR correction; FC ≥ 3).

